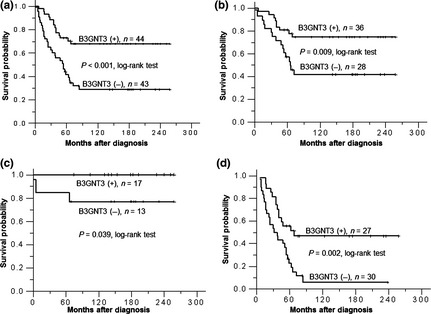
Figure 2.

(a) Kaplan–Meier survival analysis according to the expression of B3GNT3 in 87 neuroblastoma (NB) patients. P values were calculated using the log‐rank test. (b) Kaplan–Meier survival analysis according to the expression of B3GNT3 in NB patients with normal MYCN status. (c) Kaplan–Meier survival analysis according to the expression of B3GNT3 in NB patients at an early stage. (d) Kaplan–Meier survival analysis according to the expression of B3GNT3 in NB patients at an advanced stage.
