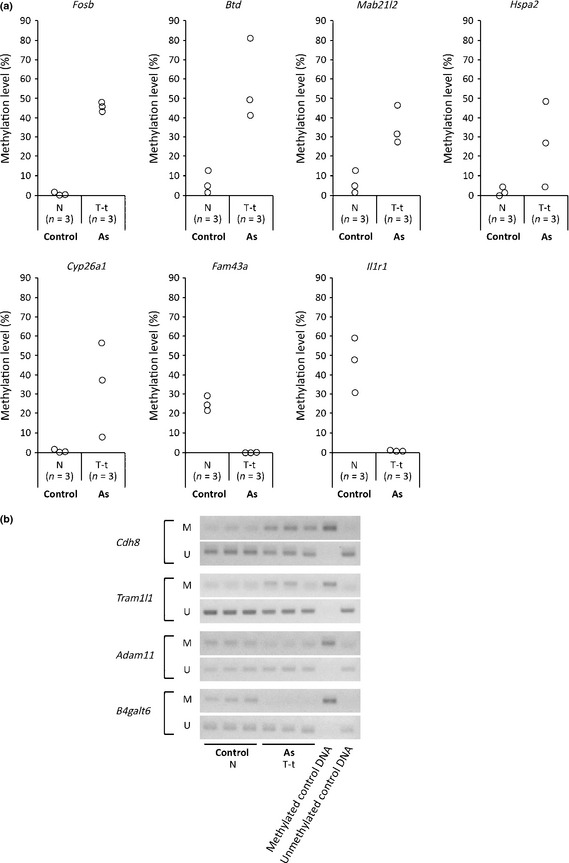
Figure 1.

Validation of data obtained by methylated DNA immunoprecipitation–CpG island microarray analysis by real‐time methylation‐specific PCR (MSP). Individual genome samples that were used for the microarray analyses (obtained from normal livers of three control mice [Control‐N] and tumor tissues from tumor‐bearing livers of three gestationally arsenic‐exposed mice [As T‐t]) were examined by real‐time MSP. (a) Methylation levels of DNA regions were measured by real‐time MSP. (b) Methylation changes of DNA regions were measured by MSP. Electrophoresis patterns of each DNA region are shown. M, M primer set; U, U primer set.
