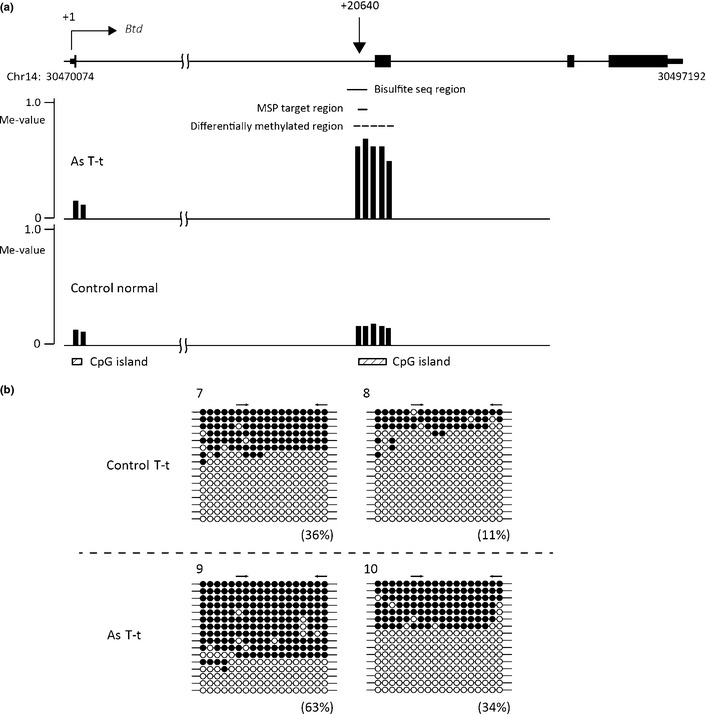
Figure 4.

Bisulfite sequencing (seq) analysis of the Btd region of tumor tissues from tumor‐bearing livers of control mice (Control T‐t) and gestationally arsenic‐exposed mice (As T‐t). (a) Schematic representation of the Btd locus. The vertical arrow indicates the approximate position of methylation‐specific PCR (MSP) primers from the transcription start site (+1). The black boxes indicate the transcribed region of Btd. Vertical bars show methylation levels (Me‐values) of each probe. Dashed lines show the areas where two or more consecutive probes in the control group or arsenic group yielded Me‐values of 0.20 or less and where the differences in the Me‐values of corresponding probes in the two groups were 0.30 or more. The MSP primers were designed in the area shown by a black line. This figure was drawn by the UCSC Genome Browser (http://genome.ucsc.edu/) on NCBI36/mm8 assembly that shows the Fosb locus on chromosome 14 (Chr14). (b) Bisulfite sequencing data of samples 7–10. The percentages in parentheses are the DNA methylation levels of each MSP primer region calculated from the data of bisulfite sequencing. The arrows indicate the positions of the MSP primers. ○, Unmethylated cytosine; ●, methylated cytosine.
