
Fig. 3: nPD-L1 switches TNFα-induced apoptosis to pyroptosis under hypoxia.
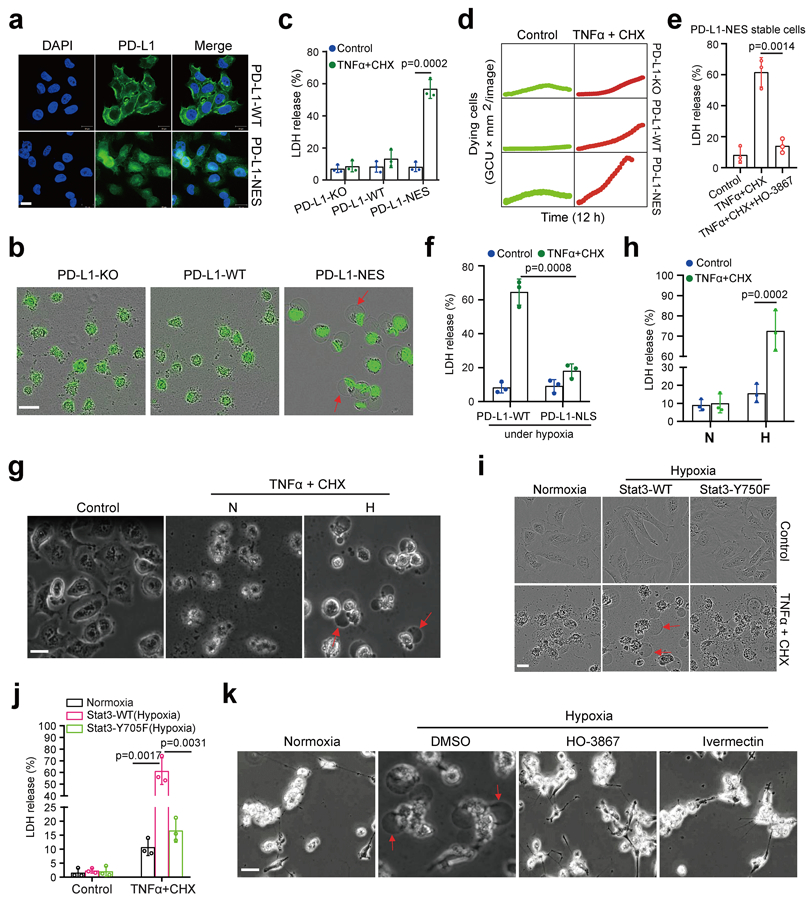
(a) Stable re-expression of WT or NES-mutated PD-L1 in the PD-L1–knockout MDA-MB-231 cells. Images of PD-L1 distribution are representative of three independent experiments. Scale bar, 20 μm. (b) Fluorescent imaging of nPD-L1-induced apoptosis-to-pyroptosis switch under TNFα plus CHX treatment. Dying cells were stained with nucleic acid dye SYTOX green. Red arrows indicate cell swelling with large bubbles. Images are representative of three independent experiments. Scale bar, 20 μm. (c) LDH-released cell death is shown as mean ± SD of n = 3 independent experiments. (d) Time-lapse microscopy quantification of dying cells treated as described in (b). (e) LDH-released cell death in PD-L1-NES stable cells treated with TNFα plus CHX and/or HO-3867. Data are shown as mean ± SD of n = 3 independent experiments. (f) MDA-MB-231-PD-L1–KO cells with stable expression of WT or NLS-mutated PD-L1 were treated with TNFα plus CHX under hypoxia. LDH-released cell death is shown as mean ± SD of n = 3 independent experiments. (g and h) MDA-MB-231 cells were treated with TNFα plus CHX under hypoxia. Representative images of dying cell morphology of three independent experiments; red arrows indicate cell swelling with large bubbles (g). Scale bar, 20 μm. LDH-released cell death is shown as mean ± SD of n = 3 independent experiments (h). N, normoxia; H, hypoxia. (I and j) MDA-MB-231 stable transfectants were treated with TNFα plus CHX under hypoxia. Representative images of dying cell morphology of three independent experiments (i). Scale bar, 20 μm. LDH-released cell death is shown as mean ± SD of n = 3 independent experiments (j). (k) MDA-MB-231 cells were co-treated with TNFα plus CHX and the p-Y705-Stat3 inhibitor HO-3867 or the importin α/β inhibitor ivermectin under hypoxia. Representative images of dying cell morphology of three independent experiments. Scale bar, 20 μm. P values of all statistical analysis were determined by two-sided Student’s t-test. Statistical source data are provided in Source Data Fig. 3.