
Extended Data Fig. 1. Establishment of stable cells in MDA-MB-231 cell line.
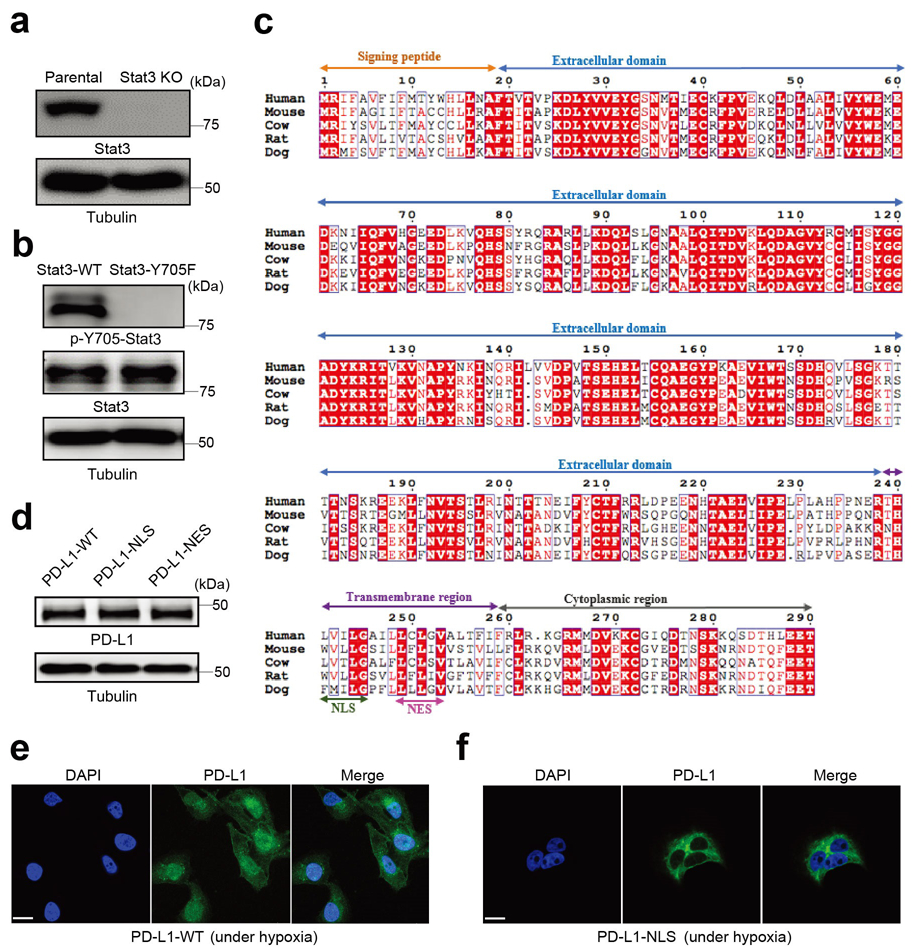
(a) Deletion of endogenous Stat3 by CRISPR/Cas9. KO, knockout. Blots are representative of three independent experiments. (b) Stable re-expression of Stat3-WT or Stat3-Y705F in Stat3-knockout MDA-MB-231 cells. Validation of p-Y705-Stat3 expression level by immunoblotting. Blots are representative of three independent experiments. (c) Analysis of the nuclear localization signal (NLS) and nuclear export signal (NES) in the human PD-L1 amino acid sequence compared with that of other species. Sequence alignment of PD-L1 from human, mouse, cow, rat, and dog. The alignment was generated and presented by the ClustalW2 algorithm and ESPript 3.0 (http://espript.ibcp.fr/ESPript/cgi-bin/ESPript.cgi). Identical residues are indicated by the dark red background and conserved residues are in red. The NLS and NES sequences of PD-L1 are conserved across species. (d-f) Stable re-expression of PD-L1-WT (wild-type PD-L1), PD-L1-NLS (NLS-mutated PD-L1) or PD-L1-NES (NES-mutated PD-L1) in the PD-L1–knockout MDA-MB-231 cell line. Immunoblotting of total PD-L1 expression level in stable transfectants (d). Blots are representative of three independent experiments. Representative images of PD-L1 distribution of three independent experiments was determined by confocal assay under hypoxia (e-f). Scale bar, 20 μm. Unprocessed blots are provided in Source Data Extended Data Fig. 1.