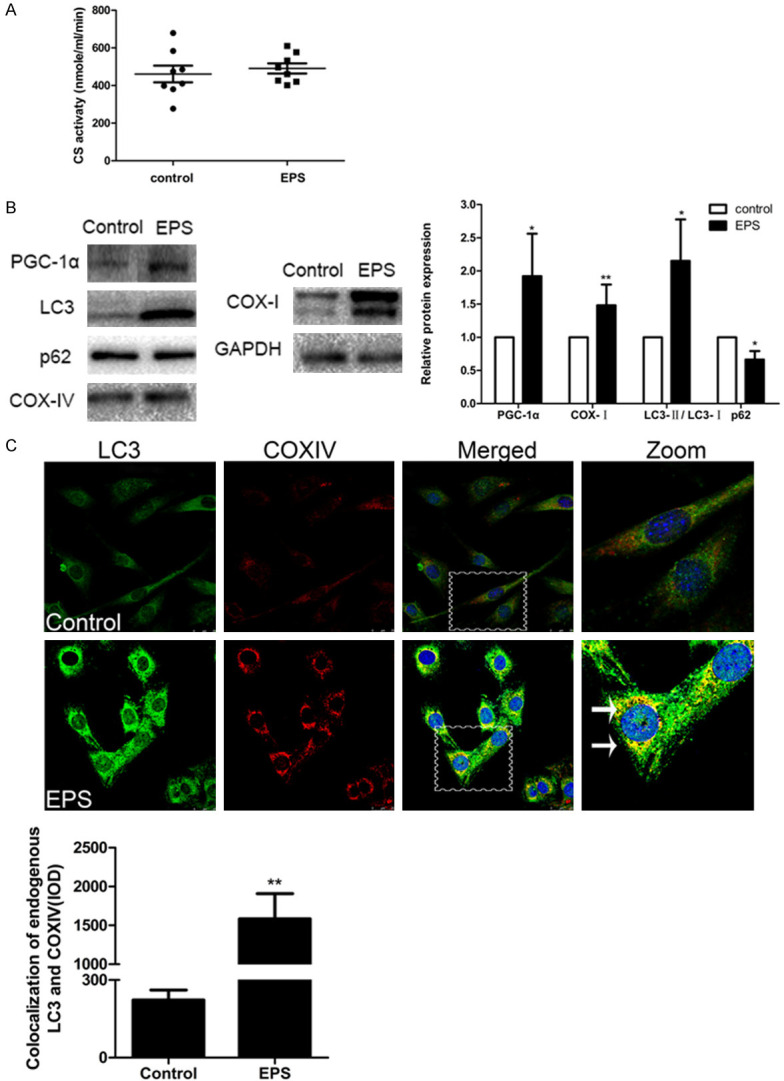
Figure 1.

EPS causes mitophagy in C2C12 cells. A. The activity of CS in control C2C12 cells and cells treated by EPS. Means ± SD (control 485±101, EPS 491±67.9) and the 8 individual values for each group are shown; P>0.05. B. Western blotting of the indicators of mitochondrial biosynthesis PGC-1α and COX-I and of the autophagy-related factors LC3 and p62. The optical densities of the different protein bands (means ± SD) are shown at the right. Data are presented as *P<0.05 or **P<0.01 in comparison to the control group (n=6). C. Immunofluorescent staining reveals that COXIV-labeled (red) mitochondria co-localize with LC3 (green) (white arrows). Nuclei are stained blue with DAPI. Scale bar, 25 µm. Quantitative analysis of the co-localization is shown beneath (means ± SD; n=6; **P<0.01 in comparison to the control group).
