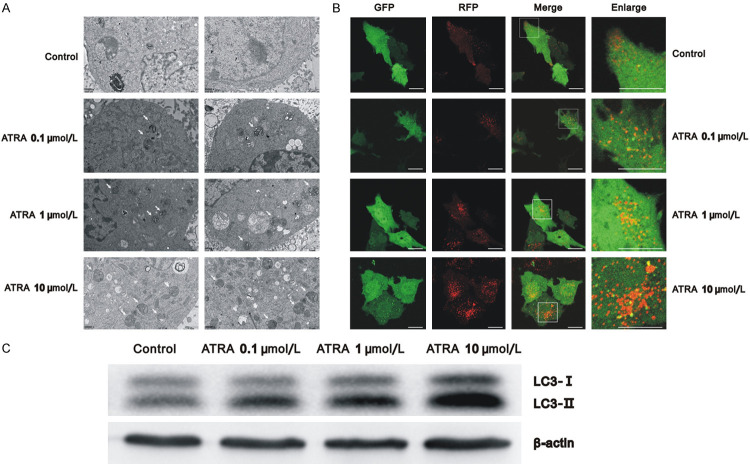
Figure 1.
ATRA-induced autophagy in a dose-dependent manner in Hepa1-6 cells. A. Cells treated with varying concentrations of ATRA had more autophagic vacuoles than the control group using Transmission electron microscopy; B. After ptfLC3 transfection, autophagy of cells treated with varying concentrations of ATRA increased and autophagic flux was unobstructed using a laser scanning confocal microscope. Scale bar = 20 μm; C. Western blots detecting the autophagy-related marker protein LC3 in cells treated with varying concentrations of ATRA for 3 days, using β-actin as a control.

