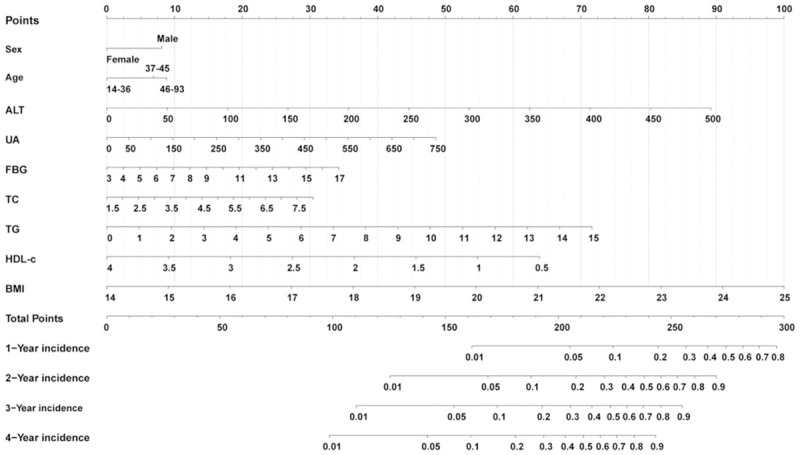
Figure 3.

Nomogram for predicting NAFLD incidence in the non-obese Chinese population. Each variable value for the individuals was determined according to the top Points scale, and then the points for each variable were added. Finally, a personalized 1-y, 2-y, 3-y, and 4-y risk of NAFLD was obtained according to the bottom Total Points scale. NAFLD: nonalcoholic fatty liver disease.
