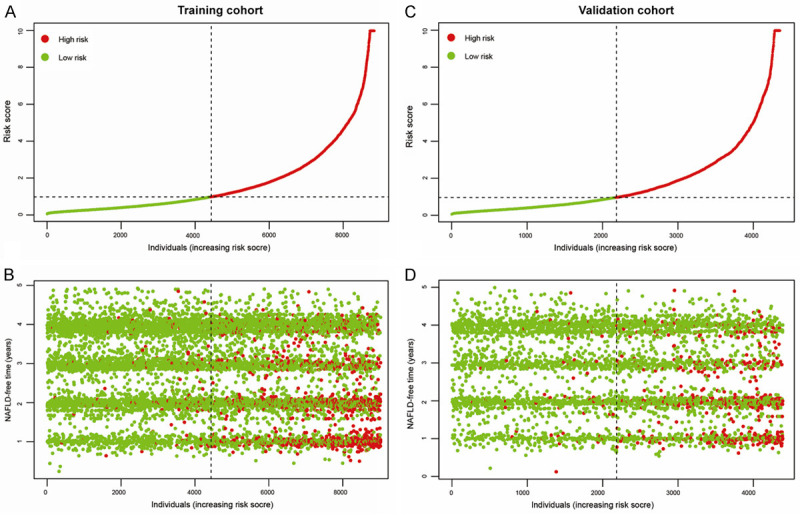
Figure 6.

Individuals were stratified into high- or low-risk groups based on the risk score. Risk score distribution and NAFLD status in the training cohort (A and B). Risk score distribution and NAFLD status in the validation cohort (C and D). Green dot represents individuals without NAFLD, and red dot represents individuals with NAFLD, indicating this model could discriminate high-risk individuals with NAFLD from the non-obese Chinese population. NAFLD: nonalcoholic fatty liver disease.
