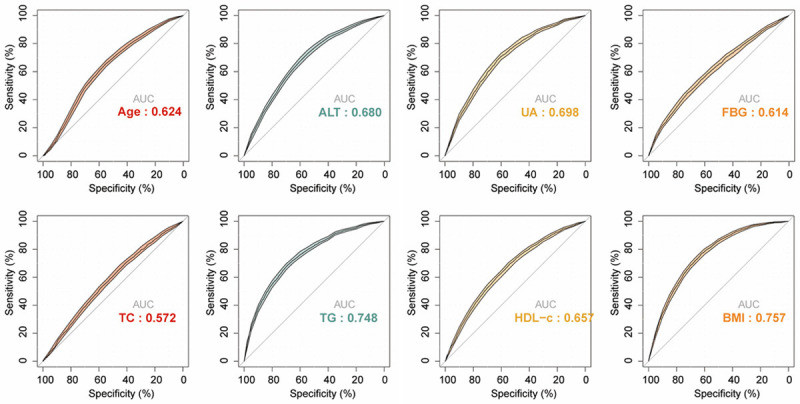
Figure 8.

The ROC curves of identified risk factors for predicting NAFLD. The AUC for age, ALT, UA, FBG, TC, TG, HDL-c, and BMI was 0.624, 0.680, 0.698, 0.614, 0.572, 0.748, 0.657, and 0.757, respectively. NAFLD, nonalcoholic fatty liver disease; BMI, body mass index; FBG, fasting plasma glucose; TC, total cholesterol; TG, triglyceride; HDL-c, high-density lipoprotein cholesterol; UA, uric acid; ALT, alanine aminotransferase.
