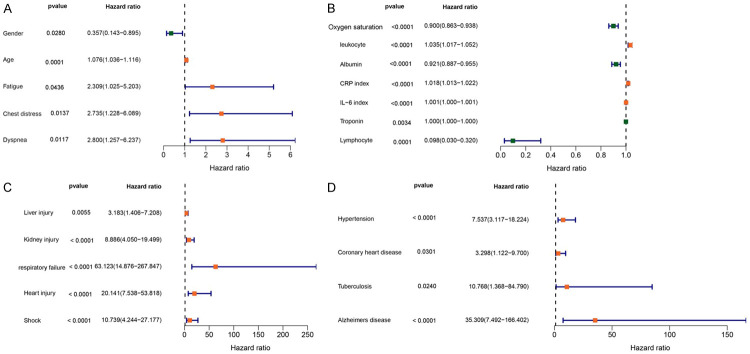
Figure 1.
Exploring the relationship between COVID-19 patients survival and clinical trait including clinical signs (A), clinical indicators (B), complications (C) and comorbidity (D) by using the cox regression analysis, the red boxplot represent the protective factors, while the green boxplot represent the risky factors.

