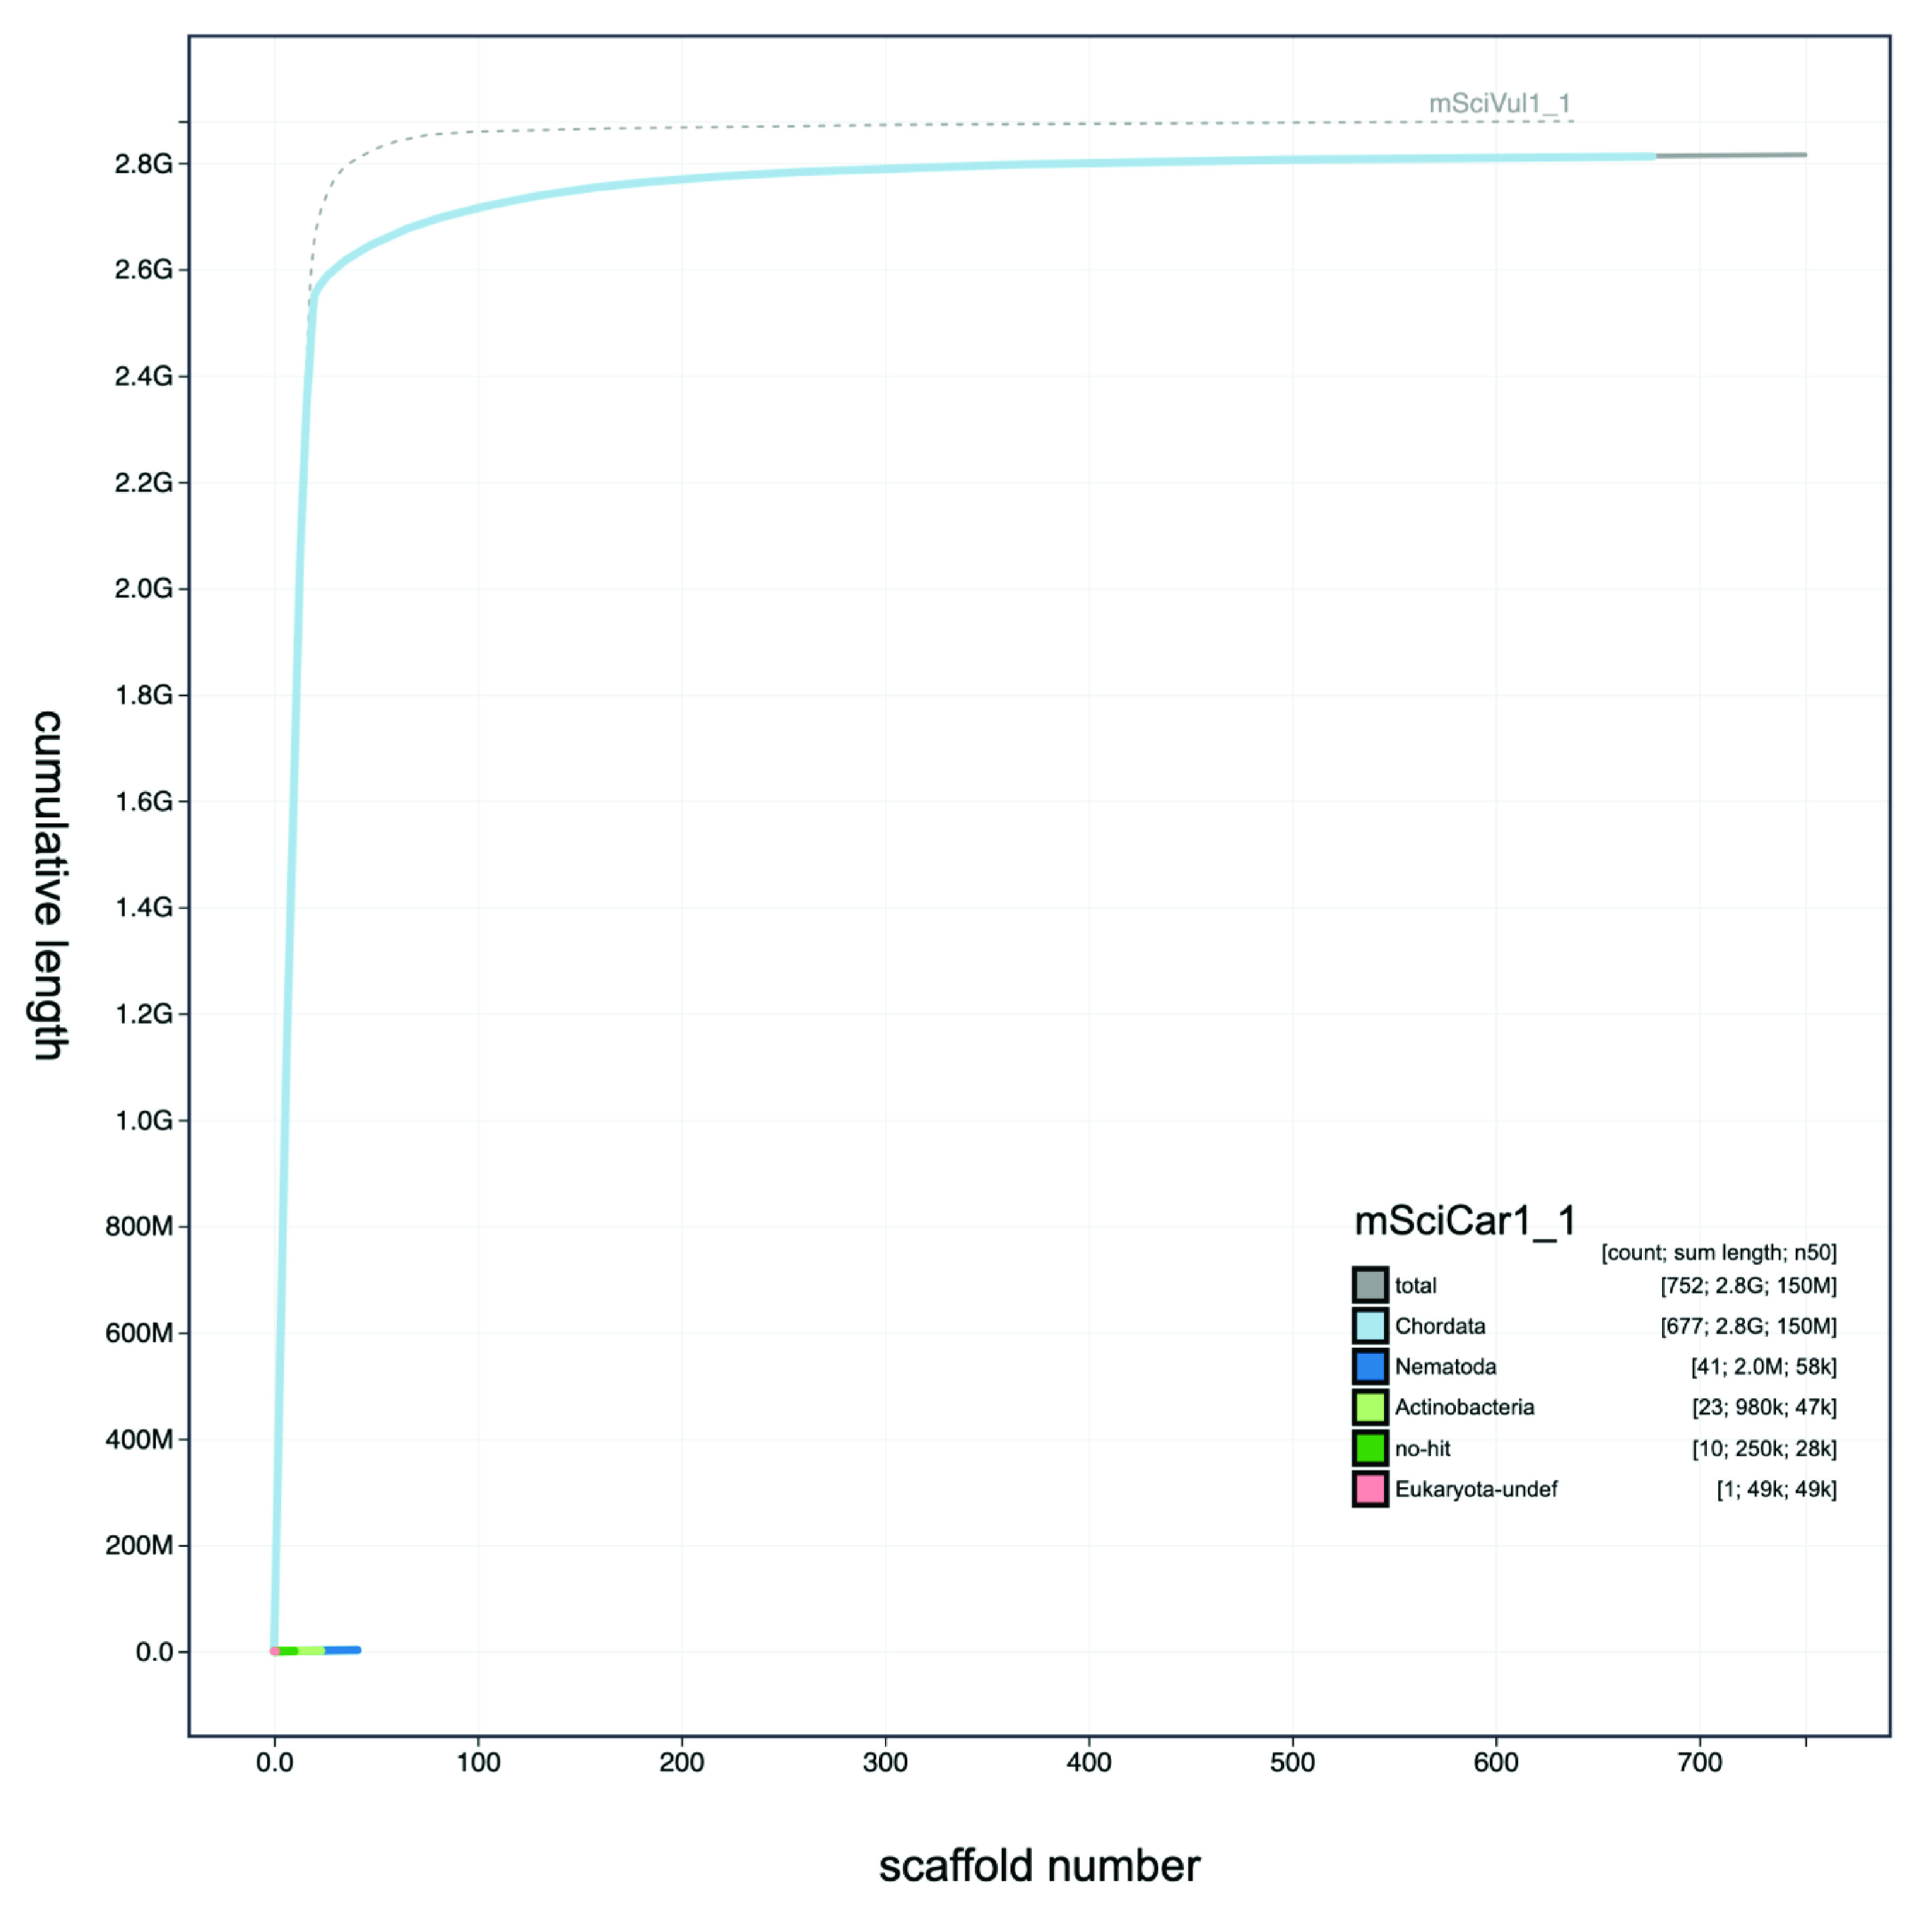
Figure 3. Genome assembly of Sciurus carolinensis mSciCar1: Cumulative sequence plot.

The blue line in the main plot shows the cumulative sequence plot for mSciCar. The sashed line shows the cumulative sequence plot of S. vulgaris mSciVul1 for comparison. The interactive version is available here.
