
Figure 2.
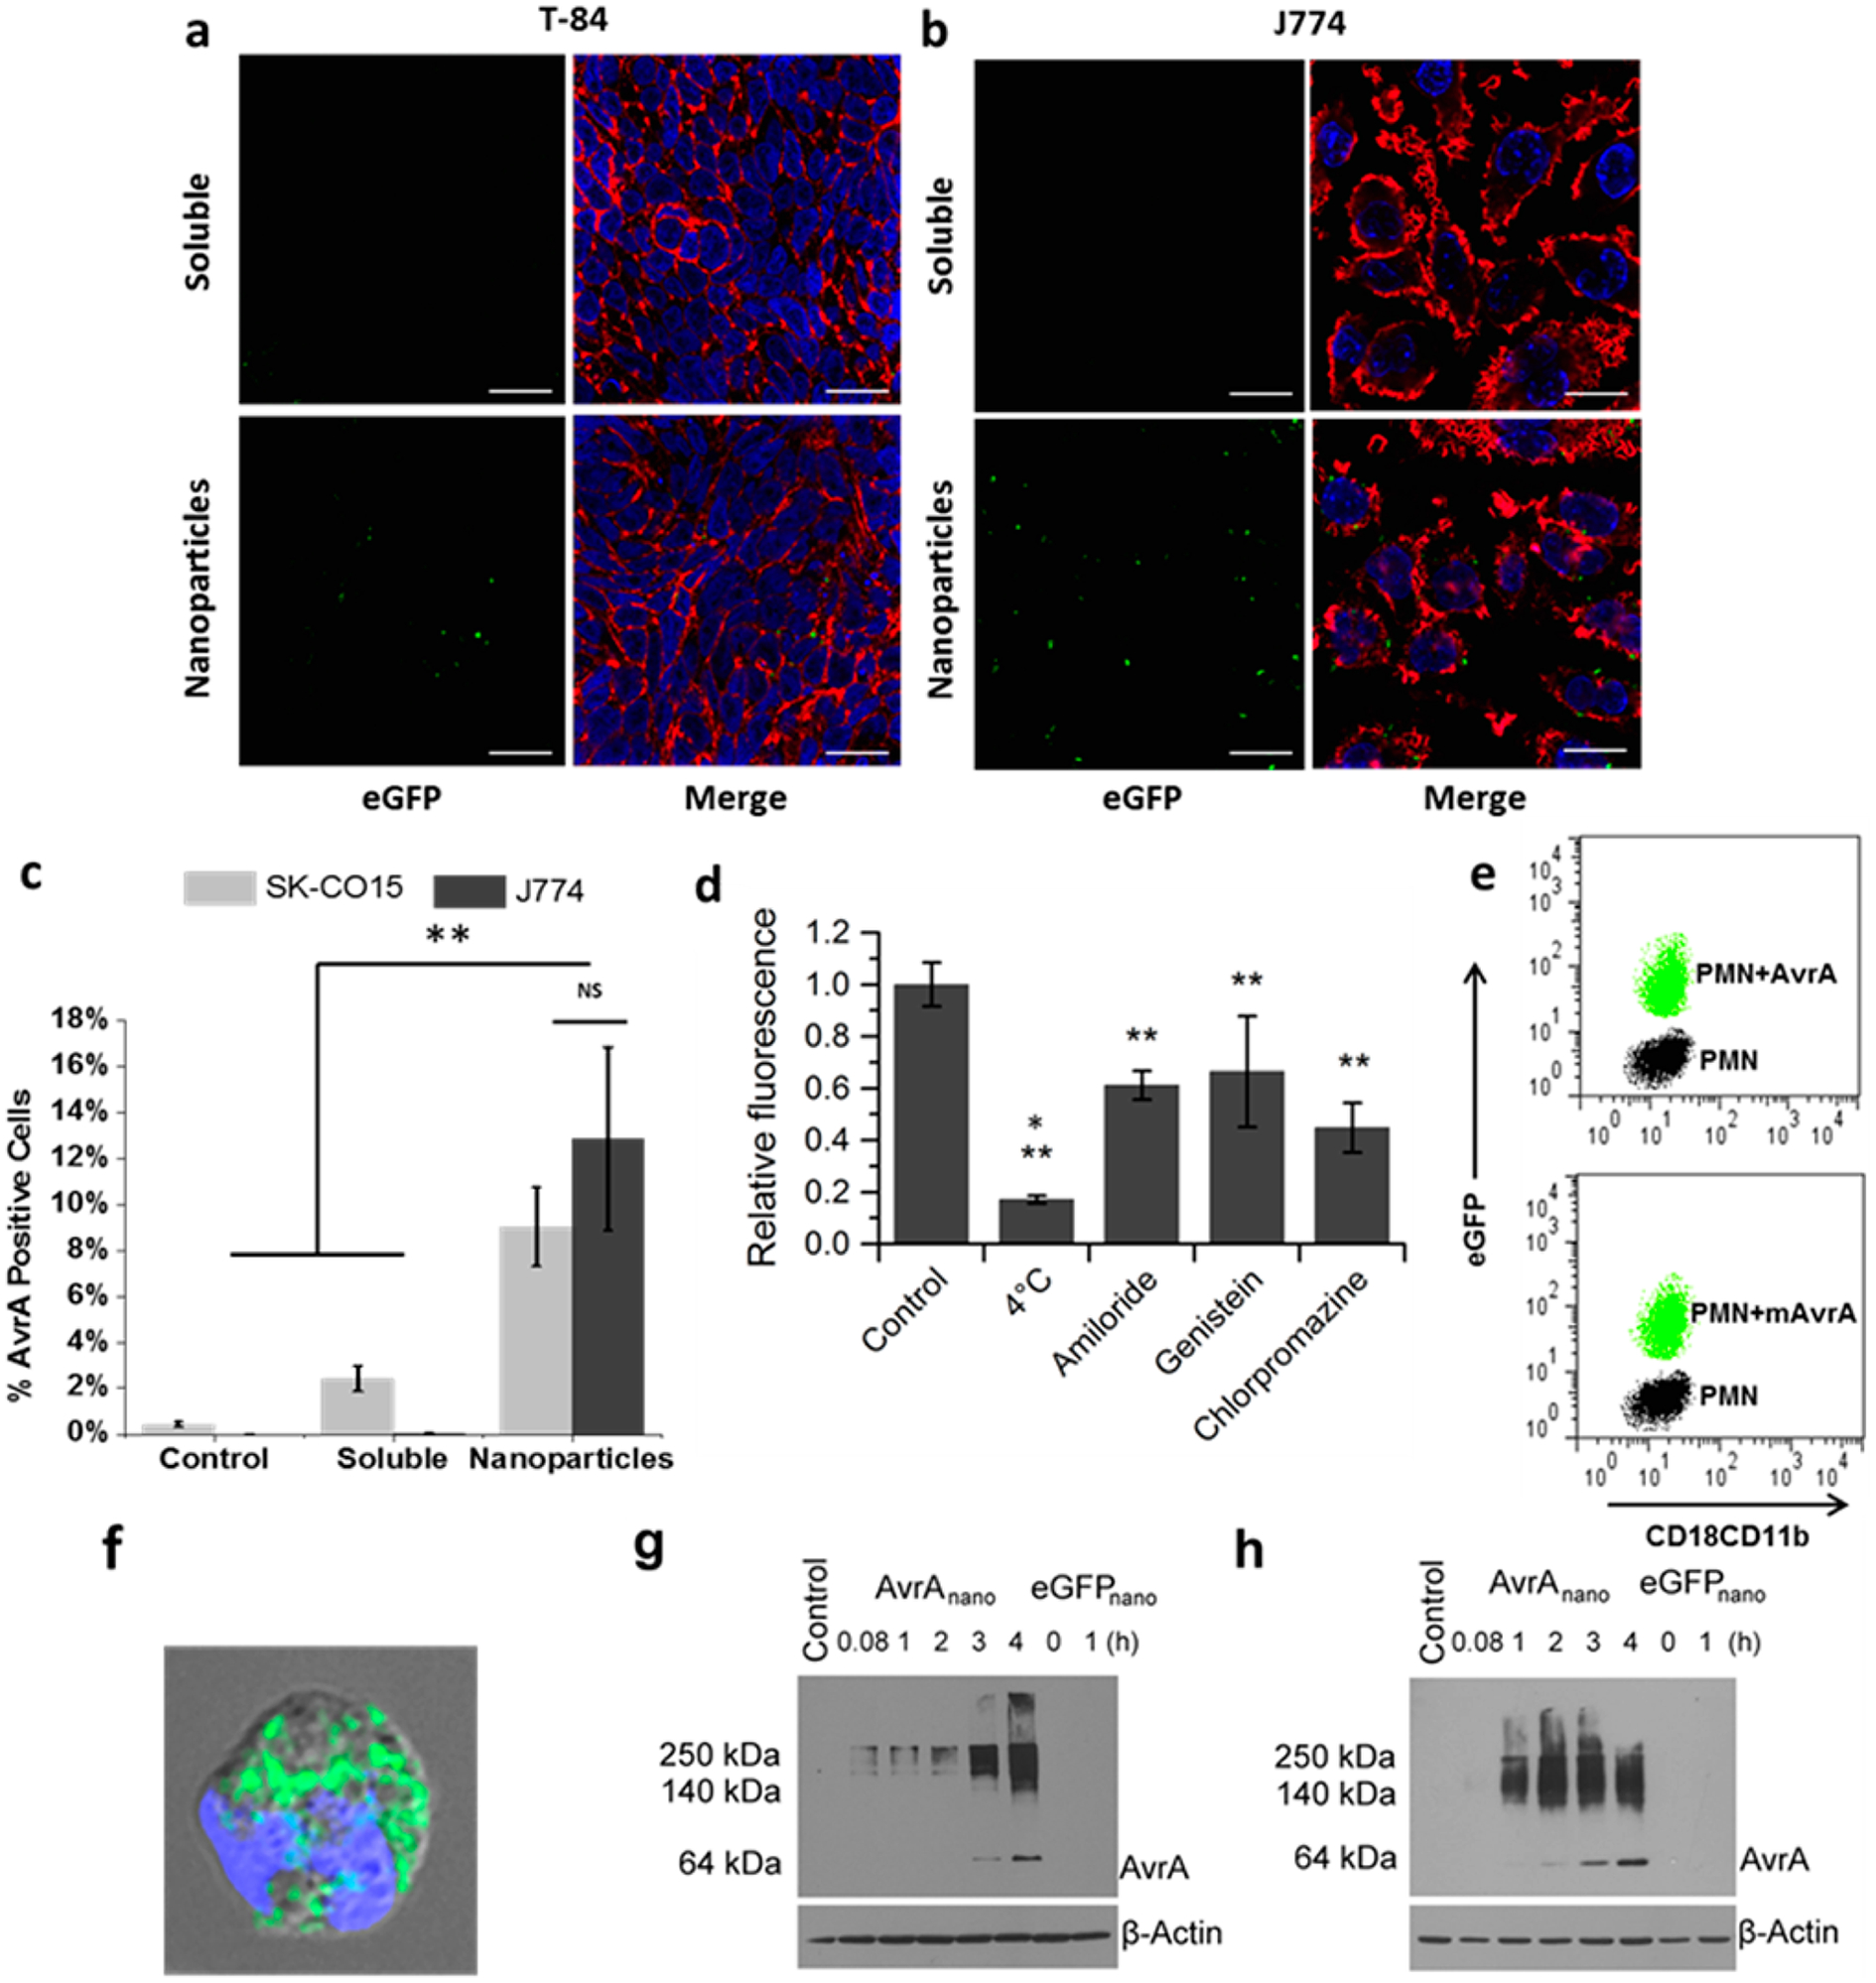
Cellular uptake of AvrA particles. Confocal images of (a) T84 and (b) J774A.1 cells incubated with mixed soluble AvrA (15 μg/mL) and eGFP (300 μg/mL), or AvrA-eGFP nanoparticles for 6 h. Images are midcell optical section overlays of eGFP fluorescence (green), nuclear Hoechst dye (blue), and actin filaments (red) labeled with rhodamine-phalloidin (scale bars 20 μm). (c) Flow cytometry quantification of soluble AvrA (15 μg/mL) and eGFP (300 μg/mL) or AvrA-eGFP nanoparticle uptake in SK-CO15 cells (light gray) and J774A.1 cells (dark gray). (d) Comparison of AvrA-eGFP nanoparticle (315 μg/mL) uptake by J774A.1 cells following pretreatment with the indicated drug. A single asterisk indicates statistical significance to all other groups; double asterisks indicate statistical significance compared only to untreated control. (e) Flow cytometry characterization of PMNs exposed to AvrA-eGFP and mAvrA-eGFP nanoparticles (500 μg/mL eGFP, 25 μg/mL (m)AvrA). eGFP represents uptake and CD18/CD11b represents activation. (f) Fluorescent/bright-field overlay of PMN uptake of AvrA-eGFP nanoparticles (scale bar 2 μm). (g) IEC-6 model intestinal epithelia and (h) IC-21 peritoneal macrophages were treated with nanoparticles for indicated times and detected by immunoblotting with anti-AvrA antibody. (*p < 0.05, **p < 0.01).