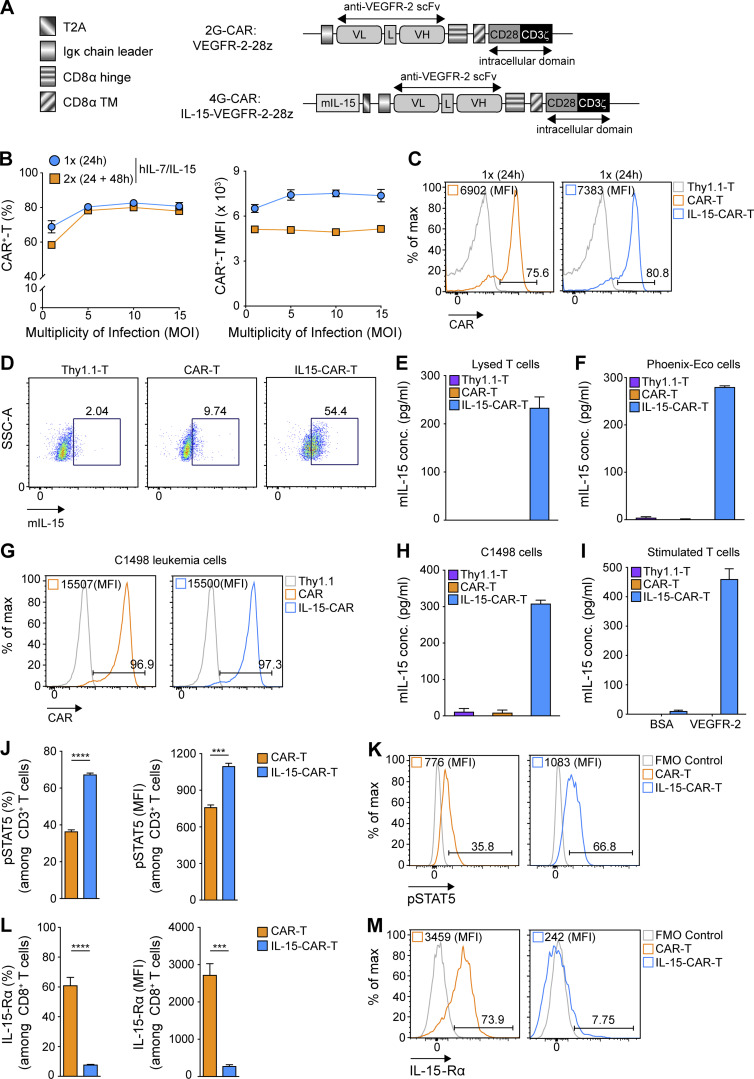
Figure 4.
Murine T cells efficiently transduced to coexpress anti-VEGFR-2 CAR and functionally active mIL-15. (A) Comparison of the 2G-CAR construct (DC101-28z) and a bicistronic vector encoding both mIL-15 and the anti-VEGFR-2 CAR (4G-CAR construct). (B) Murine T cells were transduced once (1×) or twice (2×) with 4G-CAR retrovirus at 24 h or 24 and 48 h after activation at increasing MOI. Numbers represent mean percentage and MFI of CAR ± SEM for T cells from n = 3 mice. The experiment was repeated twice. (C) Representative flow cytometry data of 2G- and 4G-CAR expression by murine T cells on day 7 after transduction. (D) Representative flow cytometry plots showing intracellular mIL-15 production by 4G-CAR-T cells as compared with 2G-CAR-T cells and Thy1.1-T cells. The experiment was performed using T cells pooled from n = 4 mice and was repeated three times. (E) mIL-15 protein expression by 4G-CAR-T cells determined by ELISA of the supernatant of lysed T cells. Results are presented as the mean concentration (pg/ml) ± SEM from triplicate wells with T cells pooled from n = 4 mice. The experiment was repeated twice. (F) Evaluation of mIL-15 levels in the supernatant of Phoenix cells 72 h after transfection. Results are presented as the mean concentration (pg/ml) ± SEM of triplicate wells. The experiment was repeated four times. (G) Flow cytometry histograms showing CAR expression on C1498 murine leukemia cells transduced to express 2G- or 4G-CAR or Thy1.1. (H) mIL-15 detected in the supernatant of 4G-CAR engineered C1498 leukemia cells. Results show the mean concentration (pg/ml) ± SEM of triplicate wells. (I) Measurement of mIL-15 secretion by 2G- and 4G-CAR-T cells at 24 h after stimulation with recombinant mVEGFR-2 or BSA. Numbers represent mean concentration (pg/ml) ± SEM of triplicate wells with T cells pooled from n = 5 mice. (J) Phosphorylated (p) STAT5 expression by 2G- versus 4G-CAR-T cells on day 2 after transduction. Numbers represent mean percentage and MFI pSTAT5 ± SEM of T cells from n = 3 mice. (K) Representative flow cytometry histograms showing pSTAT5 frequency and levels in 2G- or 4G-CAR-T cells. (L) IL-15-Rα expression by 2G- versus 4G-CAR-T cells on day 5 after transduction in the absence of exogenous cytokines. Numbers represent mean frequency and MFI of IL-15-Rα ± SEM of T cells from n = 4 mice. (M) Representative flow cytometry histograms showing IL-15-Rα frequency and levels for 2G- or 4G-CAR-T cells. Experiments in G–M were repeated three times. Statistical analyses in J and L were performed using a two-tailed unpaired Student’s t test: ***, P < 0.001; ****, P < 0.0001. FMO, fluorescence minus one; SSC-A, side scatter area.

