Figure 5.
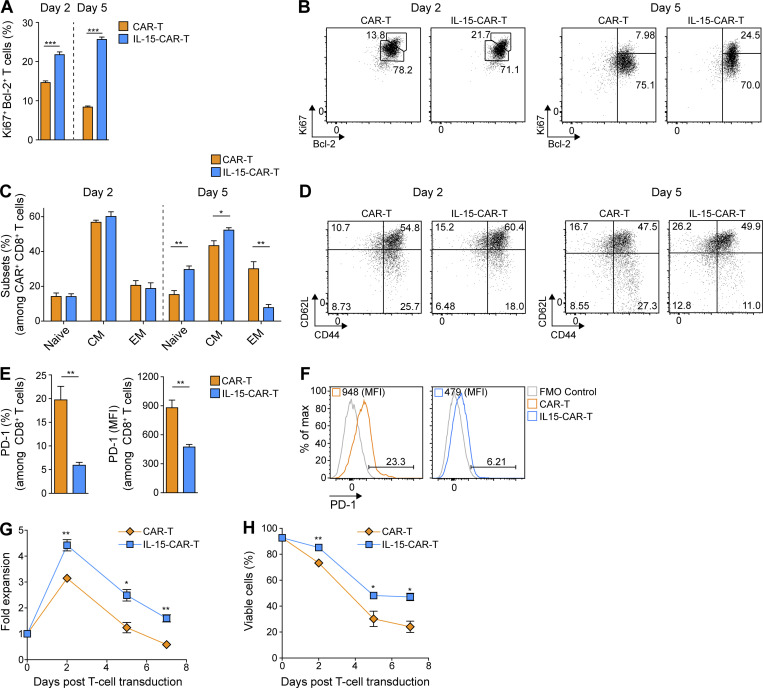
4G-CAR-T cells coexpressing mIL-15 exhibit enhanced in vitro fitness as compared with 2G-CAR-T cells. (A) Ki67 and Bcl-2 expression by 2G- versus 4G-CAR-T cells on days 2 and 5 after transduction in the absence of exogenous cytokines. Results presented are mean percentage ± SEM of T cells from n = 3 mice. (B) Representative flow cytometric analyses of 2G- and 4G-CAR-T cells stained with αKi67 and αBcl-2 Abs on days 2 and 5 after transduction. (C) Percentages of naive (CD44low CD62Lhigh), CM (CD44high CD62Lhigh), and EM (CD44high CD62Llow) of 2G- versus 4G-CAR-T cells on days 2 and 5 after transduction in the absence of exogenous cytokines. The analysis was performed using T cells derived from n = 3 mice. (D) Representative flow cytometry plots showing CD44 and CD62L expression on 2G- and 4G-CAR-T cells. Experiments in A–Dwere repeated three times. (E) PD-1 expression by 2G- versus 4G-CAR-T cells on day 5 after transduction in the absence of exogenous cytokines. Results present the mean percentage and MFI of PD-1 ± SEM of T cells from n = 3 mice. (F) Representative flow cytometry histograms showing PD-1 frequency and MFI for 2G- versus 4G-CAR-T cells. (G and H) Fold expansion (G) and viability (H) of 2G- versus 4G-CAR-T cells in the absence of exogenous cytokines. Graphs present the mean fold expansion (G) or percentage of viability (H) ± SEM of T cells from n = 3 mice. Experiments in E–H were repeated four times. Statistical analyses in A, C, E, G, and H were performed using a two-tailed unpaired Student’s t test: *, P < 0.05; **, P < 0.01; ***, P < 0.001.

