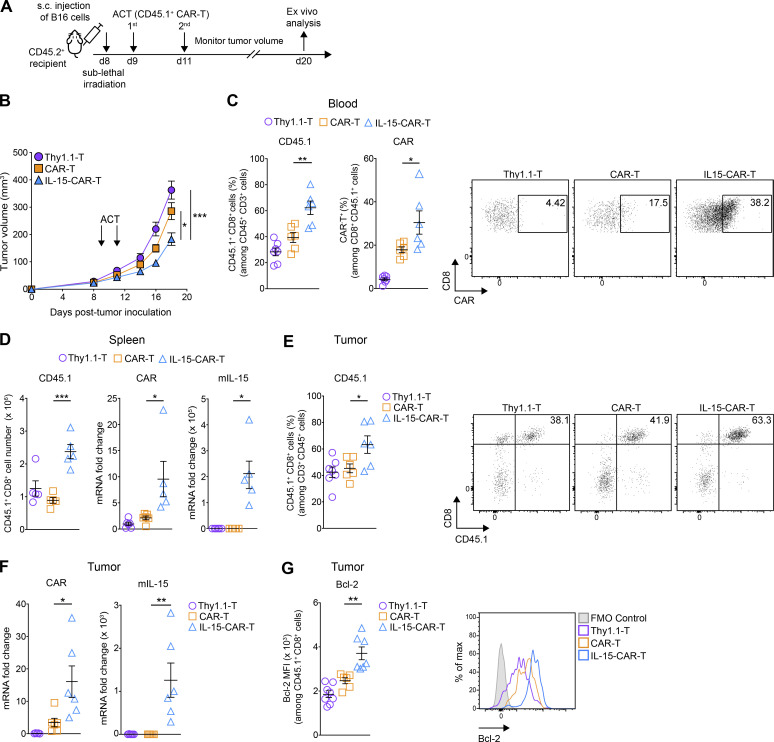
Figure 7.
4G-CAR-T cells achieve higher in vivo tumor control and persistence than 2G-CAR-T cells. (A) Schematic of ACT study and ex vivo analysis. (B) Assessment of tumor control over time for the different treatment groups. Results are expressed as mean tumor volume (mm3 ± SEM) with n = 18 mice per group pooled from three independent experiments. The experiment was repeated four times. (C) Abundance of transferred T cells in the blood (day 11 after transfer), as measured by CD45.1 staining (left) and CAR expression levels (right) (n = 6 mice per group). Shown are representative dot plots for the assessment of CAR expression. The experiments in C (left and right) were repeated three and two times, respectively. (D) Number of transferred T cells (left) and relative mRNA quantification of the CAR (middle) and mIL-15 (right) transgenes in the spleens (n = 5–6 mice per group). The experiment in the left panel was repeated three times, and the experiments in the middle and right panels were repeated twice. (E) Abundance of transferred T cells in the tumors as measured by CD45.1 staining (n = 6–7 mice per group). Shown are representative dot plots for the frequency of tumor-residing CD45.1+ CD8+ T cells. The experiment was repeated three times. (F) Relative mRNA quantification of the CAR (left) and mIL-15 (right) transgenes in the tumors (n = 5–6 mice per group). The experiments were repeated twice. (G) Expression levels of Bcl-2 (MFI) in tumor-infiltrating transferred T cells (n = 6–8 mice per group) along with representative histograms. The experiment was repeated three times. All experimental data show mean values ± SEM. Statistical analyses were performed using a two-way repeated measures ANOVA with Tukey post hoc correction test (B) and a one-way ANOVA with Tukey post hoc correction test (C–G): *, P < 0.05; **, P < 0.01; ***, P < 0.001.

