Figure 8.
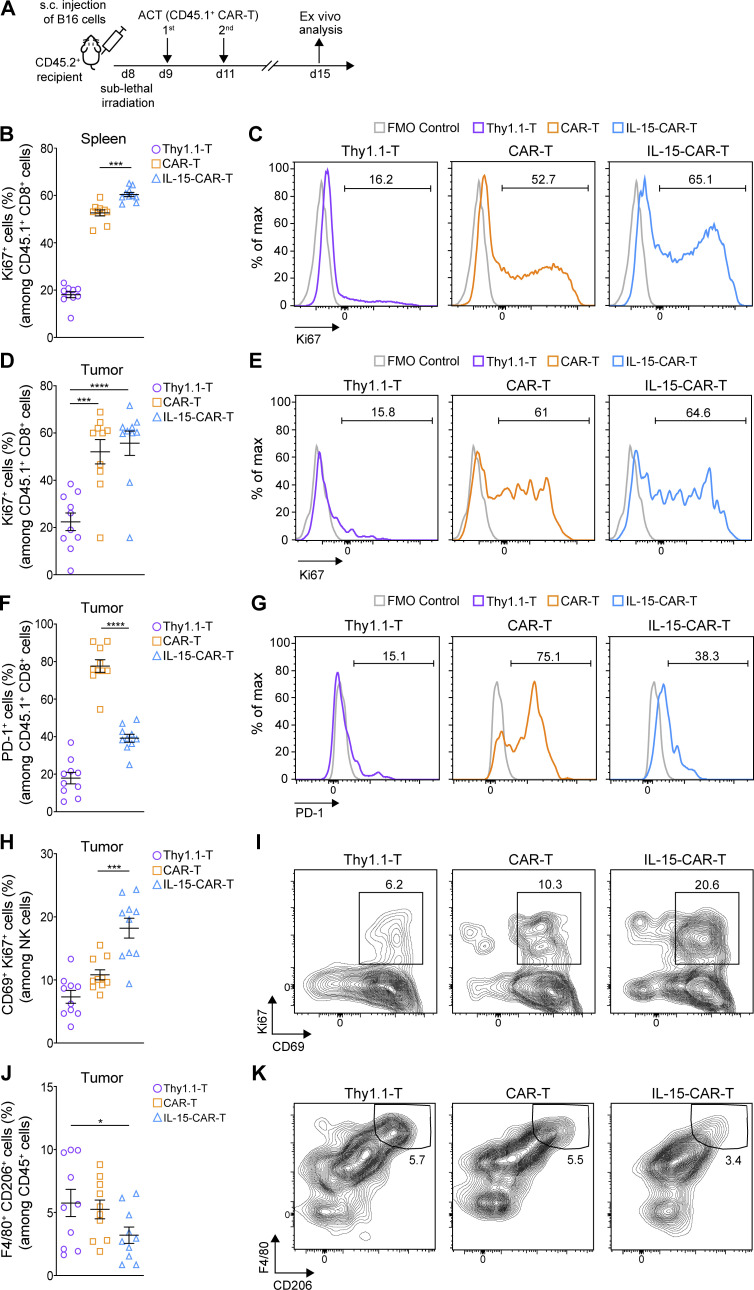
4G-CAR-T cells coexpressing mIL-15 are characterized by lower PD-1 expression than 2G-CAR-T cells in vivo and promote TME remodeling. (A) Schematic of ACT study and ex vivo analysis. (B–E) Assessment of Ki67 expression in the transferred T cells in the spleens (B) and tumors (D) of all treatment groups. Representative flow cytometry histograms showing the frequency of Ki67 in the transferred T cells in the spleens (C) and tumors (E). (F) Evaluation of PD-1 expression on the transferred T cells in the tumors. (G) Representative histograms showing the frequency of PD-1 among the transferred tumor-infiltrating T cells. (H) Assessment of the frequency of activated (CD69+ Ki67+) tumor-residing NK cells. (I) Representative contour plots showing the frequency of activated tumor-residing NK cells. (J) Assessment of the frequency of M2 (F4/80+ CD206+) tumor-infiltrating macrophages among the CD45+ cells. (K) Representative contour plots showing the frequency of tumor-residing M2 macrophages in all treatment groups. Graphs in B, D, F, H, and J present mean frequencies ± SEM of n = 10 mice pooled from two independent experiments. Statistical analyses were performed using a one-way ANOVA with Tukey post hoc correction test (B, D, F, and H) and a one-way ANOVA followed by Fisher’s least significant difference test (J): *, P < 0.05; **, P < 0.01; ***, P < 0.001; ****, P < 0.0001. FMO, fluorescence minus one.

