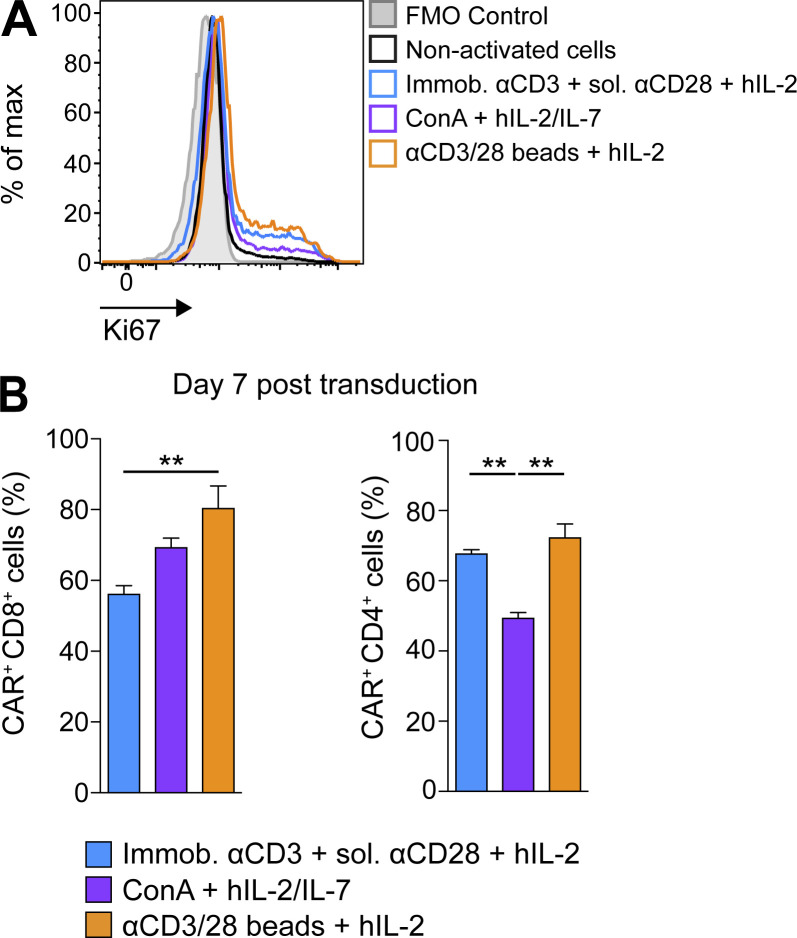
Figure S1.
Stimulation with αCD3/CD28 beads leads to the highest T cell activation and CAR transduction efficiency. (A) Representative histograms of Ki67 expression in differently activated T cells. (B) Graph bars present the mean percentage CAR expression ± SEM on differently activated and transduced CD8+ and CD4+ T cells on day 7 after transduction. All results show mean ± SEM of T cells from n = 5 mice (B, left) or n = 3 mice (B, right). The experiment was repeated twice. Statistical analyses were performed using a one-way ANOVA with Tukey post hoc correction test: **, P < 0.01. FMO, fluorescence minus one.

