Fig. 5.
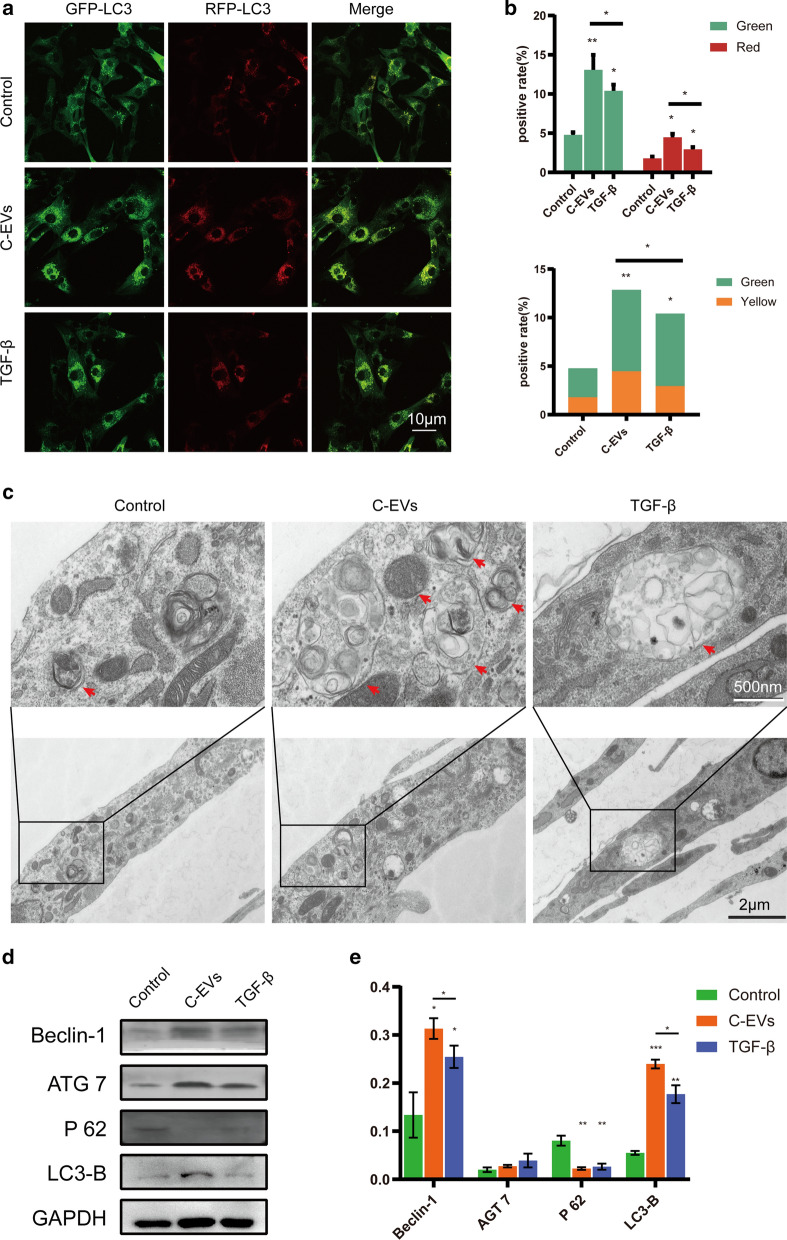
C-EVs treatment induces the activation of autophagy in HUCMSCs. a The autophagic flux of mRFP-GFP-LC3-transfected HUCMSCs was revealed using laser confocal microscopy. Autophagosomes are labelled by red and green fluorescence (yellow spots), whereas autophagic lysosomes are labelled by red fluorescence (red spots). b The percentage of fluorescence from (a) were quantified and presented as the mean ± SD of three independent experiments. *p < 0.05, **p < 0.01, ***p < 0.001. c The formation of autophagic vacuoles was observed by transmission electron microscopy. Boxed regions are enlarged and shown in insets. Red arrows indicate autophagic vacuoles. Scale bar = 2 μm. d HUCMSCs and C-EVs were incubated for 14 days, and then western blot analysis of autophagy-associated protein levels was performed. e Beclin-1, ATG7, P62, and LC3-B protein expressions were quantified and referred to GAPDH, then presented as the mean ± SD for each group. *p < 0.05, **p < 0.01, ***p < 0.001

