
Fig. 1.
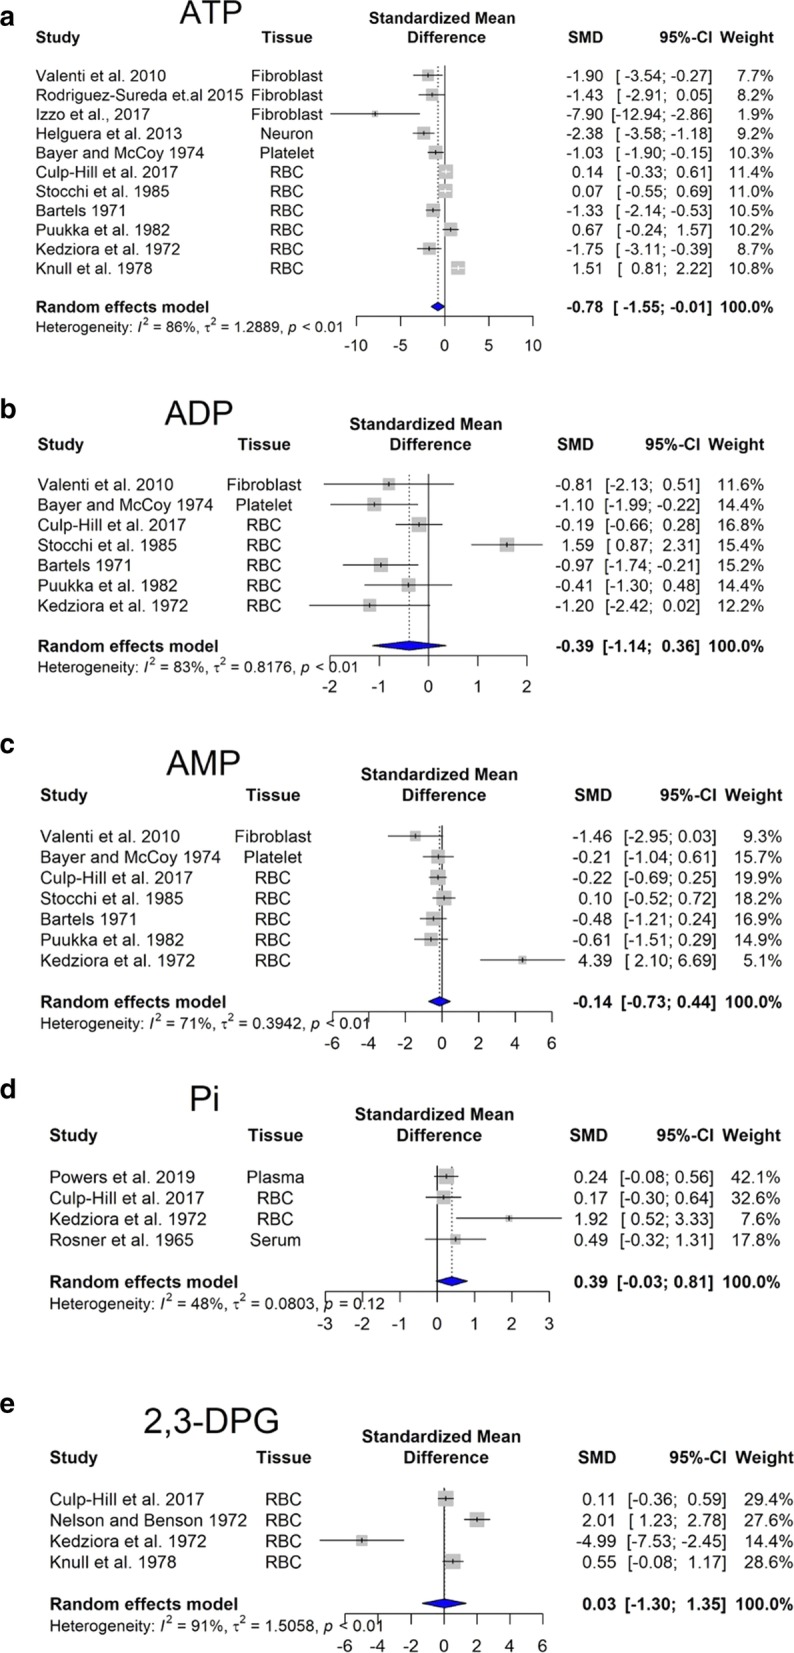
Changes in bioenergetics-related analytes in Down syndrome. Forest plot showing relative weights, standardized mean difference (Hedge’s g) with confidence intervals. Overall average effect size is displayed by filled diamond
Official websites use .gov
A
.gov website belongs to an official
government organization in the United States.
Secure .gov websites use HTTPS
A lock (
) or https:// means you've safely
connected to the .gov website. Share sensitive
information only on official, secure websites.
Changes in bioenergetics-related analytes in Down syndrome. Forest plot showing relative weights, standardized mean difference (Hedge’s g) with confidence intervals. Overall average effect size is displayed by filled diamond