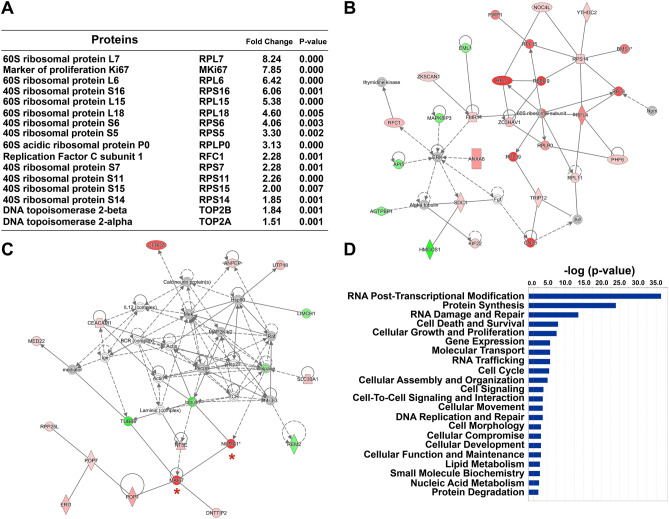
Figure 4.
Proteomic analysis of Tbk1-depleted INS-1 832/13 β-cells displays changes in processes important for cell growth and proliferation. (A) Top focus proteins increased in Tbk1-depleted INS-1 832/13 β-cells. (B,C) Two of the top protein network interactomes generated from focus and reference proteins identified in siTbk1-treated relative to control β-cells, converging onto the assembly of 60S ribosomal subunit (B) and MKi67 (C; red asterisks). Red and green intensities indicate upregulated and downregulated protein expression, respectively. Gray indicates protein was detected but did not meet focus protein threshold criteria. Solid and dashed line indicate a direct or indirect interaction, respectively. (D) Comparison analysis of the top molecular and cellular functions associated with focus proteins in siTbk1-treated β-cells.

