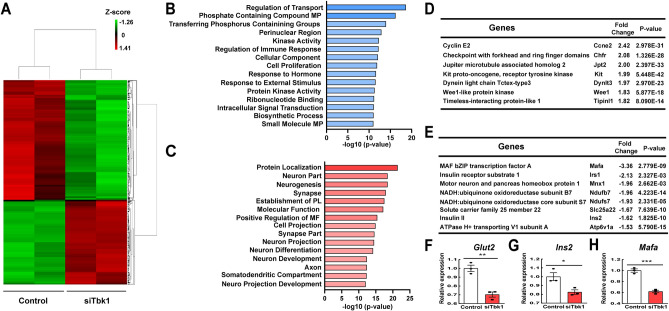
Figure 5.
Transcriptome analysis of Tbk1-depleted INS-1 832/13 β-cells reveals a proliferative response and diminished maturity. (A) Heat map of the genes significantly altered upon Tbk1 depletion. At least ± 1.5 fold change and a false discovery rate (FDR) cutoff of < 0.05 as well as P < 0.05 are defined as significantly altered focus genes. (B,C) Gene ontology (GO) analysis showing pathways differentially upregulated (B) or downregulated (C) in siTbk1-treated as compared to control INS-1 832/13 β-cells. (D) List of genes showing prominent increase of expression upon Tbk1 depletion. (E) List of genes showing prominent decrease of expression upon Tbk1 depletion. (F–H) RT-qPCR analysis of β-cell genes that confer mature features Glut2 (F), Ins2 (G), and Mafa (H) in control and SiTbk1-treated INS-1 832/13 β-cells. Gene expression was normalized to that of Gapdh and presented as fold changes (± SEM) against control expression. 3 sample sets per treatment, triplicate per each sample set. Unpaired two-tailed t-test. Asterisk indicates statistical significance: *P < 0.05; **P < 0.01; ***P < 0.001.

