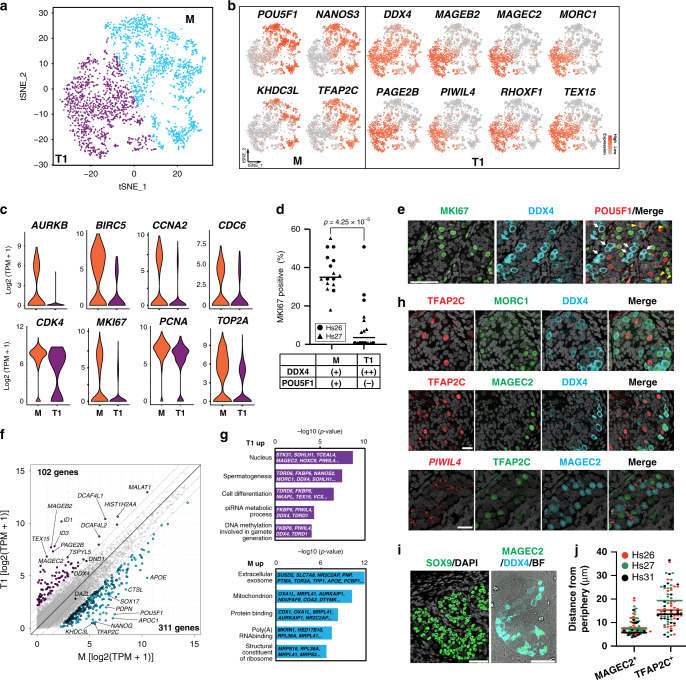
Fig. 1. Characterization of germ cells in human fetal testis during the second trimester.
a tSNE plot of germ cells (GCs) defined in Supplementary Fig. 1c. Cluster identities were determined by projecting the expression of marker genes onto the same tSNE plot in (b). M, M-prospermatogonia (cyan); T1, T1-prospermatogonia (purple). b tSNE feature plots of known and newly identified markers for M and T1. c Violin plots of proliferation markers for M (1,419 cells) or T1 (1170 cells) defined in (a) and (b). FDR < 10−65 for all markers. d Percentages of MKI67+ cells among DDX4+POU5F1+ M or DDX4++POU5F1− T1 present in Hs26 (18w0d, black circle) or Hs27 (18w5d, black triangle) samples as assessed by immunofluorescence (IF) analysis. Each dot represents the count per tubular cross section (8 cross sections per sample). P-values for the comparison is determined by two-sided Fisher’s exact test (p = 4.25 × 10⁻⁵). e IF images of a paraffin section of fetal testis (Hs27) targeted for MKI67 (green) and DDX4 (cyan), merged with DAPI (white) and/or POU5F1(red). White arrows indicate DDX4++POU5F1− T1 and yellow arrowheads indicate DDX4+POU5F1+ M co-expressing MKI67. Scale bar, 50 μm. f Scatter plot comparing averaged gene expression levels between M and T1 (top). Cyan, genes higher in M; purple, genes higher in T1 (more than fourfold difference [flanking diagonal lines], mean log2[TPM+1] > 2, FDR < 0.01). Key genes are annotated and the number of DEGs are indicated. g Gene Ontology (GO) analysis of the DEGs defined in (f). P-value (one-sided Fisher-exact test) and representative genes assigned to each GO term are shown. h IF images of paraffin sections of Hs31 for TFAP2C (red) and DDX4 (cyan) combined with MORC1 (green, top) or MAGEC2 (green, middle), and images for combined in situ hybridization (co-ISH) for PIWIL4 (red) with IF for TFAP2C (green) and MAGEC2 (cyan) (bottom). All images are merged with DAPI (white). Merged images for all four color channels are shown at far right. Scale bars, 25 μm. i IF images of paraffin sections of Hs26 for SOX9 (green) merged with DAPI (left) or for MAGEC2 (green) and DDX4 (cyan) merged with bright field (BF) (right). IF for SOX9 and BF highlight the border between tubules and the stroma. Scale bars, 50 μm. j Distances (μm) from the periphery of tubules for TFAP2C+MAGEC2− M or TFAP2C−MAGEC2+ T1 as quantified by IF images for Hs26 (red), Hs27 (green), and Hs31 (purple). Bars indicate the median value for each cell type per sample. n = 78 (Hs26, 28 cells; Hs27, 30 cells; HS31, 20 cells) and 75 (Hs26, 27 cells; HS27, 22 cells; HS31, 26 cells) for TFAP2C−MAGEC2+ T1 and TFAP2C+MAGEC2− M, respectively. See also Supplementary Fig. 1 and Supplementary Dataset 1.

