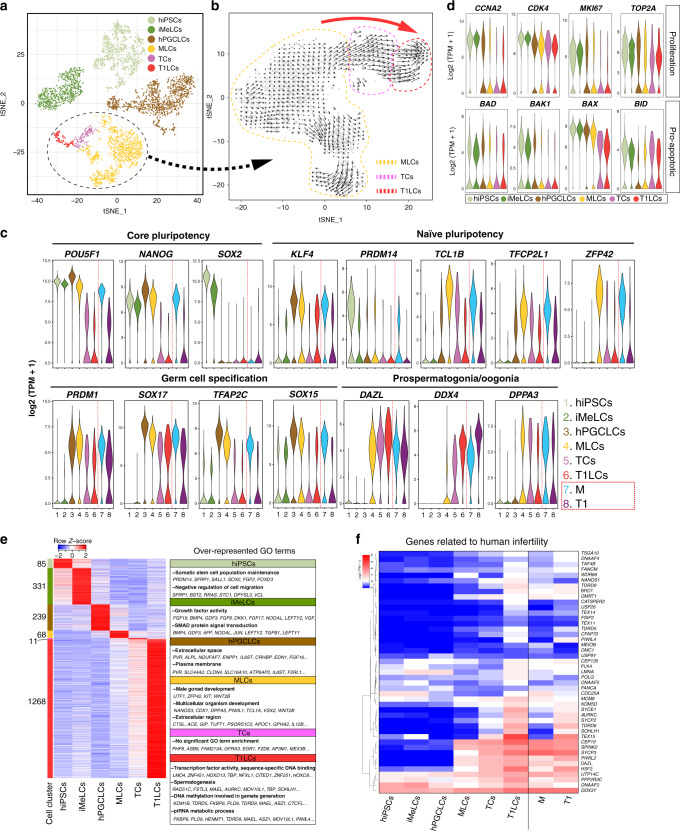
Fig. 4. Single-cell transcriptome profiling of in vitro derived human GCs.
a A tSNE plot of all in vitro cells using computationally aggregated scRNA-seq data obtained from six different samples (hiPSCs; iMeLCs; hPGCLCs_1; hPGCLCs_2, d81 xrTestis, d124 xrTestis). These cells are colored based on clusters defined in Supplementary Fig. 4b and c: hiPSCs (1168 cells, pale green); iMeLCs (800 cells, green), hPGCLCs (1371 cells, brown), MLCs (1224, yellow), TCs (162 cells, purple) and T1LCs (150 cells, red). The cluster re-analyzed in (b) is outlined by a dotted line. b Velocity analysis focused on a cluster outlined by a dotted line in (a) projected on the tSNE space defined in Supplementary Fig. 4f. Black arrows indicate the lineage trajectory estimated using nascent transcripts from scRNA-seq data in (a). Dotted lines enclose cells representing MLCs (yellow), TCs (purple) or T1LCs (red) as defined in Supplementary Fig. 4f. Large red arrow indicates the overall direction of the lineage trajectory at the borders of cell clusters. c Violin plots showing the expression of representative markers in in vitro (left) or in vivo (right) cell clusters defined in Figs. 1a, 4a. d Violin plots showing the expression of representative proliferation markers (top) or pro-apoptotic markers (bottom) in the respective cell clusters. e Heatmap showing the expression pattern of DEGs identified from a multi-group comparison (FDR < 0.01, fold change > 2 compared to other clusters) among cell clusters, and the over-represented GO terms in these DEGs. Color bars on the left indicate DEGs for respective cell clusters. The number of DEGs for each cell cluster are shown at the side of the color bar. f Heatmap of the expression of 45 genes in which mutations are associated with “spermatogenic failure” or “male infertility” in humans. Genes are ordered by UHC (Ward’s method). See also Supplementary Figs. 4–7 and Supplementary Dataset 2.

