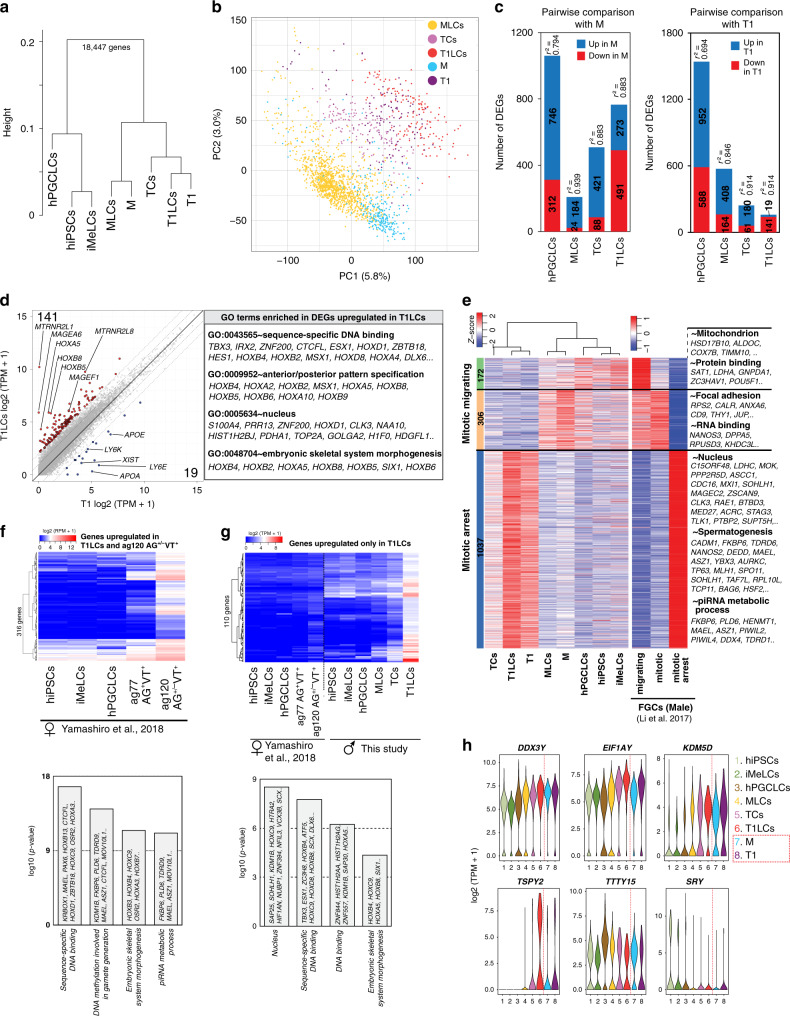
Fig. 5. Comparison of lineage projection in vitro with that of in vivo.
a UHC of the averaged transcriptomes of in vivo (M, T1) and in vitro cell clusters (hiPSCs, iMeLCs, hPGCLCs, MLCs, TCs, T1LCs) defined in Figs. 1a, 4a. b PCA for prospermatogonial stage GCs (M, MLCs, TCs, T1, and T1LCs). Color codes for cell clusters are indicated. c Number of DEGs and coefficient of determination (r2) for pairwise comparisons between in vivo (M [left] or T1 [right]) and in vitro clusters (hPGCLCs, MLCs, TCs, and T1LCs). DEGs are defined as genes with more than fourfold differences between two groups (mean log2[TPM+1] > 2, FDR < 0.01). r2 are calculated using all annotated genes (18447 genes). d Scatter plot comparison of the averaged values of gene expression between T1 and T1LCs. Blue, genes higher in T1; red, genes higher in T1LCs (more than 4-fold differences [flanking diagonal lines], mean log2[TPM+1] > 2, FDR < 0.01). Key genes are annotated and the number of DEGs are indicated. Representative genes and their GO enrichments for genes higher in T1LCs are shown on the right. e Heatmaps of the expression of markers for “migrating” (172 genes), “mitotic” (306 genes), and “mitotic-arrest” (1037 genes) human male FGCs (defined by Li et al.11) in the respective cell clusters defined in this study (left) and the indicated male FGC types defined by Li et al.11 (right). Using these markers, hierarchical clustering was performed for cell clusters defined in this study (left). GO terms for the respective markers are shown on the right. f Heatmap of the averaged expression values of 316 genes in indicated cell types defined by Yamashiro et al.15 (top). Among markers for T1LCs defined in Fig. 4e, 1177 genes were also annotated in the dataset by Yamashiro et al.15. Among them, 316 genes upregulated in ag120 AG+/−VT+ oogonia-like cells relative to all other cell types (more than twofold difference) are shown (top). GO analysis for these 316 genes are also shown (bottom). g Heatmap of the averaged expression in the indicated cell types for 110 genes highly expressed in T1LCs but with weak or no expression in ag120 AG+/−VT+ oogonia-like cells. To enable comparison between two different scRNA-seq platforms, RPM values of the data from Yamashiro et al. were adjusted using a polynomial regression curve (see “Methods”). Among 1,177 DEGs for T1LCs (Fig. 4e), 110 genes showing high levels of expression in T1LCs (mean log2[TPM+1] > 4) and low levels of expression in oogonia-like cells (adjusted log2[RPM+1] < 2) are shown. GO analysis for these 110 genes are also shown (bottom). h Violin plot showing the expression levels of genes at the male-specific regions of the Y chromosome (MSY) in indicated cell clusters. These genes were identified the by multi-group DEG analysis in Fig. 4e (without cut-off by fold-change > 2). See also Supplementary Figs. 4, 6, 7, Supplementary Dataset 3–5.

