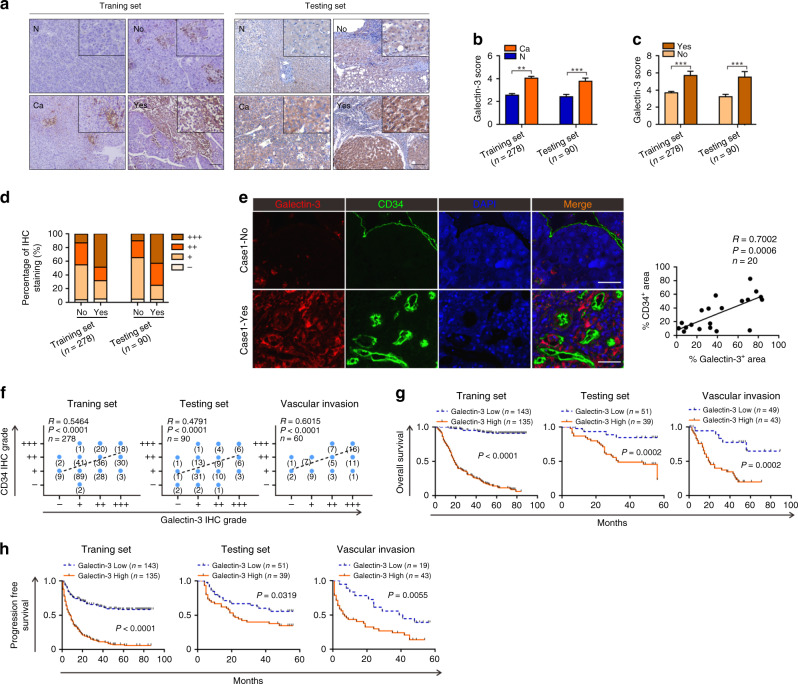
Fig. 1. A high level of Galectin-3 expression is significantly associated with vascular invasion and poor survival in HCC patients.
a−c IHC staining shows the expression level of Galectin-3 in HCC tissues and paired adjacent normal tissues, as well as in HCC tissues with or without vascular invasion in the training and testing sets. Scale bars, 100 μm. d The percentage of Galectin-3 IHC staining grade in patients with or without vascular invasion in the training and testing sets. e Tissue IF staining shows the co-expression pattern of Galectin-3 (red) and CD34 (green) in the HCC tumour microenvironment. DAPI, blue. Figure panel pairs representative images taken with different zooming options; Scale bars, 100 μm. f Spearman’s correlation analysis of the association between Galectin-3 and CD34 in the training (left), testing (middle), and vascular invasion (right) sets. g, h Survival analyses between “Galectin-3 high” and “Galectin-3 low” groups for the overall survival (g) and progression-free survival (h) based on IHC staining in the training (left), testing (middle), and vascular invasion (right) sets. N normal, Ca cancer, No without vascular invasion, Yes with vascular invasion. The results represent three independent experiments. **P < 0.01; ***P < 0.001.

