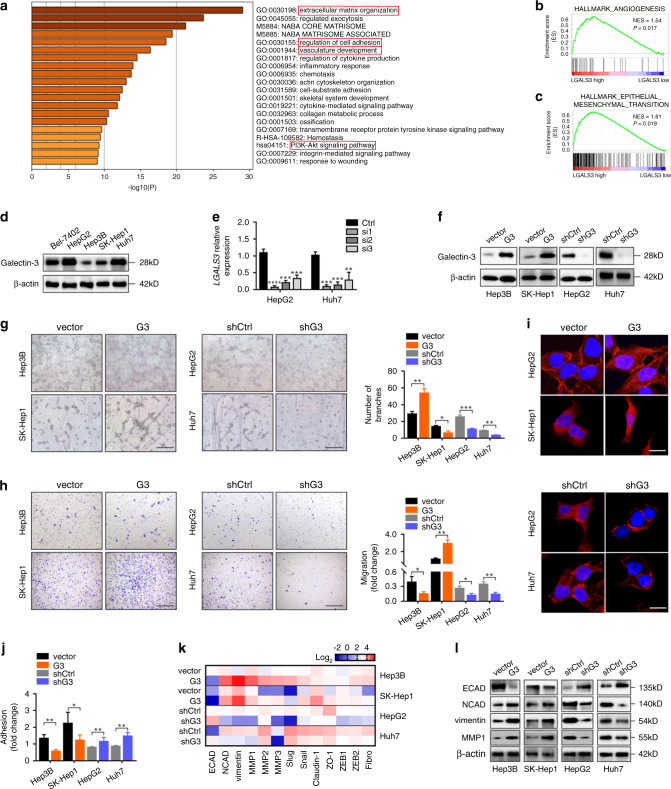
Fig. 2. Galectin-3 promotes the angiogenesis and EMT of HCC cells in vitro.
a GO analysis was performed according to the HCC mRNA sequencing data from TCGA to identify Galectin-3-associated GO terms; the top 20 terms are shown. b, c GSEA based on the HCC mRNA sequencing data from TCGA as performed to analyse the correlation between Galectin-3 and angiogenesis (b) and EMT (c). d Western blotting shows the expression of Galectin-3 in HCC cell lines, including Bel-7402, HepG2, Hep3B, SK-Hep1 and Hun7. e qPCR shows the mRNA expression of LGALS3 in Hep3B and SK-Hep1 cells transfected with siControl, siLGALS3#1, siLGALS3#2 or siLGALS3#3. f Western blotting shows the expression of Galectin-3 in Hep3B-vector, Hep3B-Galectin-3, SK-Hep1-vector, SK-Hep1-Galectin-3, HepG2-shControl, HepG2-shGalectin-3, Huh7-shControl and Huh7-shGalectin-3 cells. g–j Tube formation assay (g), Transwell migration assay (h), IF assay for phalloidin (i), and cell adhesion assay (j) in Hep3B-vector, Hep3B-Galectin-3, SK-Hep1-vector, SK-Hep1-Galectin-3, HepG2-shControl, HepG2-shGalectin-3, Huh7-shControl and Huh7-shGalectin-3 cells. Scale bars in g, h, and i are 200 μm, 200 μm, and 20 μm, respectively. k PCR array shows the expression of EMT-related genes in Hep3B-vector, Hep3B-Galectin-3, SK-Hep1-vector, SK-Hep1-Galectin-3, HepG2-shControl, HepG2-shGalectin-3, Huh7-shControl and Huh7-shGalectin-3 cells. l Western blotting shows the expression of ECAD, NCAD, vimentin and MMP1 in Hep3B-vector, Hep3B-Galectin-3, SK-Hep1-vector, SK-Hep1-Galectin-3, HepG2-shControl, HepG2-shGalectin-3, Huh7-shControl and Huh7-shGalectin-3 cells. Ctrl control, G3 Galectin-3. The results represent three independent experiments. *P < 0.05; **P < 0.01; ***P < 0.001.

