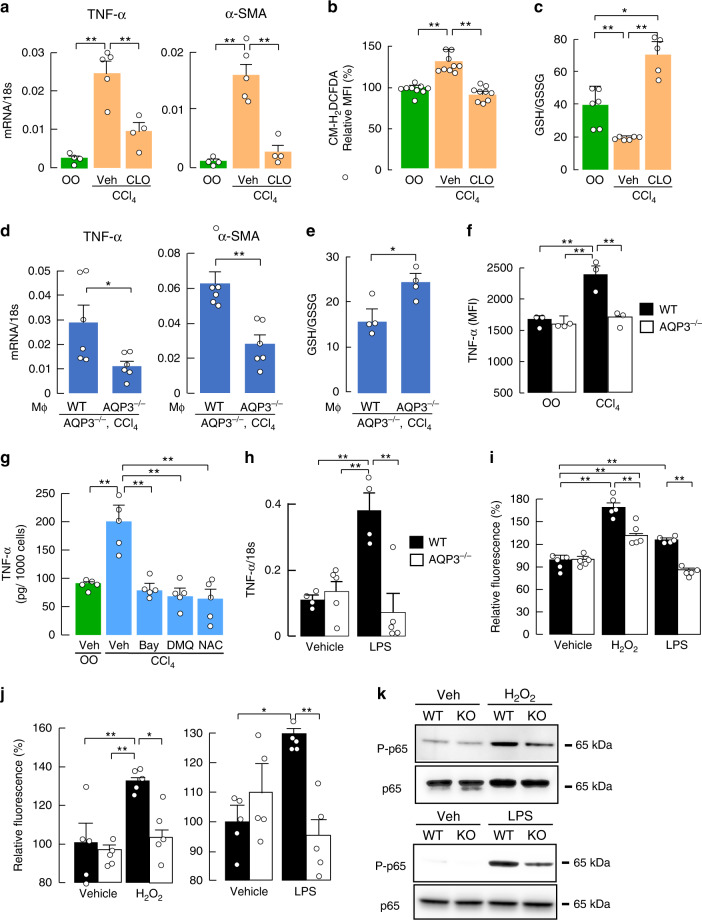
Fig. 2. AQP3-dependent macrophages activation is required for acute liver injury.
a–c Clodronate liposomes (CLO, 10 ml/kg) were injected intravenously, and injected CCl4 intraperitoneally (1 ml/kg) or vehicle olive oil (OO) after 48 h. a mRNA expression of TNF-α and α-SMA in liver homogenates determined by real-time RT-PCR (mean ± SE, n = 4 for olive oil and clodronate/CCl4, n = 5 for vehicle/CCl4 mice/group, **p < 0.01). b MFI of CM-H2DCFDA by FACS analysis in hepatocytes (mean ± SE, n = 9 biologically independent samples, **p < 0.01). c Ratio of GSH to GSSG in the liver homogenate (mean ± SE, n = 6 for olive oil and vehicle/CCl4, n = 5 for clodronate/CCl4 mice/group, *p < 0.05, **p < 0.01). Statistical analysis for (a)–(c) was performed by two-way ANOVA with Tukey’s multiple comparisons test. d, e WT or AQP3−/− mouse-derived macrophages (5 × 10⁶ cells/200 μl PBS/head) were injected intravenously into AQP3−/− mice 1 h before CCl4 injection. d mRNA expression of indicated genes in liver homogenates (mean ± SE, n = 6 mice/group, *p < 0.05, **p < 0.01 by two-tailed unpaired Student t-test). e Ratio of GSH to GSSG in liver homogenate (mean ± SE, n = 4 mice/group, *p < 0.05 by two-tailed unpaired Student t-test). f TNF-α expression in CD11B+ F4/80+ hepatic macrophage after CCl4 injection or olive oil (OO) was analyzed by FACS as shown in Supplementary Fig. 2c. MFI of TNF-α (mean ± SE, n = 3 biologically independent samples, **p < 0.01 by two-way ANOVA with Tukey’s multiple comparisons test). g TNF-α amount in culture medium by ELISA assay. CD11B+ macrophages were magnetically isolated from WT liver with or without CCl4 injection, and cultured with BAY11-7082 (20 μM), DHMEQ (1 μg/ml), or NAC (50 μM) (mean ± SE, n = 5 biologically independent samples, **p < 0.01 by one-way ANOVA with Dunnett’s multiple comparisons test). h, i CD11B+ macrophages were magnetically isolated from WT or AQP3−/− mouse liver. h Cells were treated with LPS (10 ng/ml) for 24 h. mRNA expression of TNF-α as the ratio to 18 s (mean ± SE, n = 4 for WT, n = 5 for AQP3−/− biologically independent samples, **p < 0.01). i H2O2 uptake into CD11B+ liver macrophages. Cells were stimulated with H2O2 (30 μM) for 30 s or LPS (100 ng/ml) for 1 min, and cellular H2O2 was detected with CM-H2DCFDA fluorescence using a plate reader (mean ± SE, n = 5 biologically independent samples, **p < 0.01). j–k Bone marrow-derived macrophages were generated from WT or AQP3−/− mice. j Cells were stimulated with H2O2 (30 μM) for 30 s or LPS (100 ng/ml) for 1 min. Cellular H2O2 was detected using CM-H2DCFDA fluorescence using a plate reader (mean ± SE, n = 5 biologically independent samples, *p < 0.05, **p < 0.01). Statistical analysis for (h)–(j) was performed by two-way ANOVA with Tukey’s multiple comparisons test. k Cells were incubated with H2O2 (300 μM) or LPS (100 ng/ml) for 30 min. Representative immunoblot using antibodies against phospho-p65 or p65. Source data, including exact p values and uncropped immunoblot image, are provided as a Source data file.

