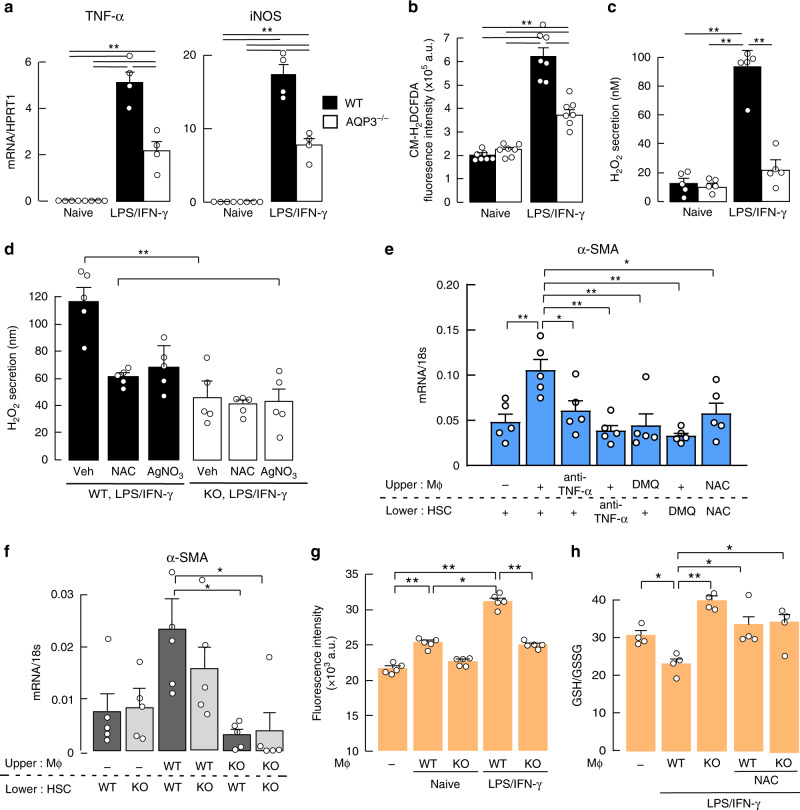
Fig. 3. Activated macrophages are involved in HSC activation and hepatocyte oxidative stress.
a–d Naive bone marrow-derived macrophages from WT or AQP3−/− mice were treated with LPS/IFN-γ (1 ng/ml; 10 ng/ml) for 24 h. a mRNA expression of TNF-α and iNOS. Data are expressed as the ratio to HPRT1 (mean ± SE, n = 4 biologically independent samples, **p < 0.01). b Cellular ROS level (mean ± SE, n = 7 biologically independent samples, **p < 0.01). c H2O2 release into the culture medium (mean ± SE, n = 5 biologically independent samples, **p < 0.01). d H2O2 release to the culture medium from WT and AQP3−/− cells. After 24 h of LPS/IFN-γ treatment, cells were incubated with NAC (50 μM) or AgNO3 (AQP3 inhibitor, 20 μM, 1 h), and H2O2 release to the culture medium measured (mean ± SE, n = 5 biologically independent samples, **p < 0.01). Statistical analysis for (a)–(d) was performed by two-way ANOVA with Tukey’s multiple comparisons test. e, f HSCs from naive mice were co-cultured with hepatic macrophages from CCl4-injected mice using a polycarbonate transwell membrane filter. e WT-derived HSCs or macrophages were incubated with anti-TNF-α (1 μg/ml) or DHMEQ (DMQ, 1 μg/ml) and then co-cultured. NAC (50 μM) was added to the culture medium. mRNA expression of α-SMA in HSCs (mean ± SE, n = 5 biologically independent samples, *p < 0.05, **p < 0.01 by one-way ANOVA with Dunnett’s multiple comparisons test). f HSCs from WT or AQP3−/− mice were co-cultured with WT or AQP3−/− mouse-derived macrophages for 24 h. mRNA expression of α-SMA in HSCs (mean ± SE, n = 5 biologically independent samples, *p < 0.05 by one-way ANOVA with Dunnett’s multiple comparisons test). g, h WT hepatocytes were co-cultured with macrophages from WT or AQP3−/− mice. Some macrophages were treated with LPS/IFN-γ (24 h) and subsequent co-culture (24 h). g Intracellular H2O2 in hepatocytes was monitored by CM-H2DCFDA fluorescence (mean ± SE, n = 5 biologically independent samples, *p < 0.05, **p < 0.01). h Ratio of GSH to GSSG in hepatocytes (mean ± SE, n = 4 biologically independent samples, *p < 0.05, **p < 0.01). Statistical analysis for (g)–(h) was performed by one-way ANOVA with Tukey’s multiple comparisons test. Source data, including exact p values, are provided as a Source data file.

