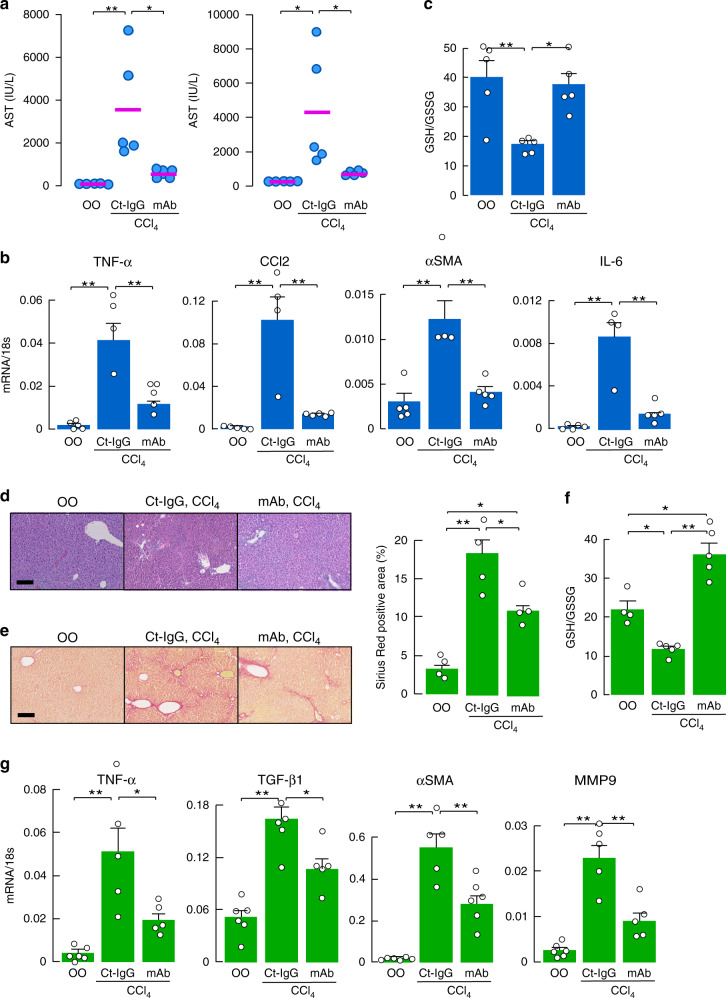
Fig. 6. Prevention of acute and chronic liver injury by anti-AQP3 mAb.
a–c Effect of anti-AQP3 mAb on acute liver injury. Anti-AQP3 (mAb-J, 10 mg/kg weight, PBS) or control monoclonal anti-mouse IgG (Ct-IgG, 10 mg/kg weight, PBS) was injected intravenously 1 day before CCl4 injection (1 ml/kg weight, olive oil; OO). Liver and blood were collected at 24 h. a Serum AST and ALT (mean ± SE, n = 5 mice/group, *p < 0.05, **p < 0.01). b mRNA expression of indicated genes by real-time RT-PCR (mean ± SE, n = 4 for control IgG/CCl4, n = 5 for olive oil and anti-AQP3 mAb/CCl4 mice/group, **p < 0.01). Data are expressed as the ratio to 18s RNA. c Ratio of GSH to GSSG in the liver homogenate (mean ± SE, n = 5 mice/group, *p < 0.05, **p < 0.01). d–g Effect of anti-AQP3 on chronic liver injury. CCl4 (0.5 ml/kg) or vehicle olive oil (OO) was intraperitoneally injected twice a week for 4 weeks. Anti-AQP3 mAb (mAb-J, 10 mg/kg, PBS) or control monoclonal anti-mouse IgG (Ct-IgG, 10 mg/kg, PBS) was intravenously injected 1 day before each CCl4 injection. d Hematoxylin and eosin staining of liver. Bar, 100 µm. e Sirius red staining. Bar, 200 µm. (right) Sirius red-positive staining area (mean ± SE, n = 4 sections from four individual mice, *p < 0.05, **p < 0.01). f Ratio of GSH to GSSG in the liver homogenate (mean ± SE, n = 4 for olive oil, n = 5 for CCl4 mice/group, *p < 0.05, **p < 0.01). g mRNA expression of indicated genes in liver homogenates by real-time RT-PCR. Data are expressed as the ratio to 18s (mean ± SE, n = 6 for olive oil, n = 5 for CCl4 mice/group, *p < 0.05, **p < 0.01). Statistical analysis for (a)–(g) was performed by one-way ANOVA with Tukey’s multiple comparisons test. Source data, including exact p values, are provided as a Source data file.

