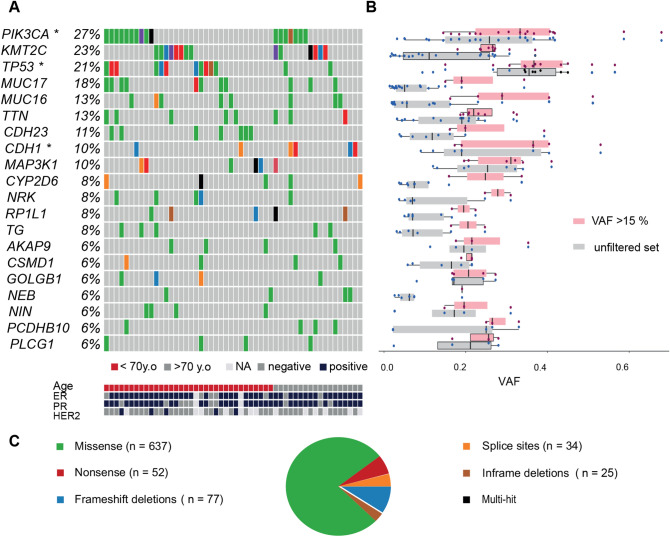
Figure 1.
Onco-plot of somatic SNVs in the Swedish breast cancer cohort. (A) Brick plot of somatic mutations in frequently and significantly mutated genes (SMGs). Each horizontal lane describes a single gene and the vertical lines represent different samples while different colors indicate the type of mutations (described in 1C). Age and hormone receptor status in the Swedish BC cohort are schematically described with patients ordered by age (under 70 years old shown in red, or above 70 years old shown in gray) and the receptor expression (ER, PR, HER2) is also shown (blue is positive expression, grey is negative). SMGs (PIK3CA, TP53 and CDH1) are marked with *. KMT2C contains mutations in 23% of the cohort. PIK3CA and KMT2C-mutated individuals are evenly distributed between the two age groups and 85% of TP53-mutated individuals were found in the younger group. In addition, CDH23 mutations were found exclusively in the younger age group. (B) Boxplot of the mutation variant allele fraction (VAF) per gene before (grey) and after VAF filtration 15% (light pink). The amount and clustering of variants is shown with red dots depicting the filtered set and the black dots the unfiltered set. The SMGs contain clusters of mutations with high VAF. (C) Breakdown of the different type of somatic SNVs and InDels. Missense mutations were most commonly observed (green, n = 637), followed by frameshift InDels (blue), and nonsense mutations (red). Notably, CDH1 contained more splice site mutations (orange).

