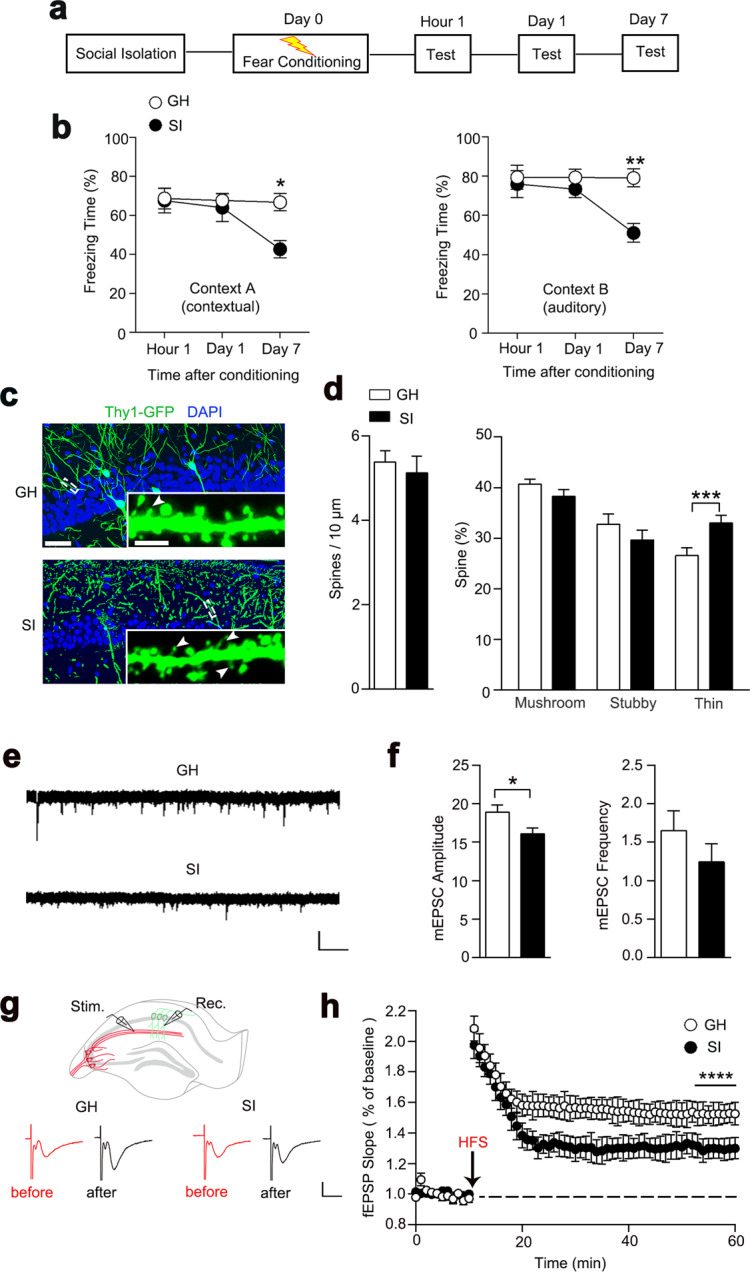
Fig. 1. Four-week isolated mice showed the forgetting of long-term fear memory.

a Experimental paradigm for the memory process in fear conditioning. b Long-term memory was impaired in SI (4 W) mice compared with GH mice. GH, n = 11 mice; SI, n = 7 mice, two-way ANOVA, context A, effect of time, F(2, 57) = 3.522, P < 0.05; effect of group, F(1, 57) = 4.767, P < 0.05; group × time, F(2, 57) = 2.743, P > 0.05. Tukey multiple-comparison test: hour 1: P > 0.05; day 1: P > 0.05; day 7: P < 0.05. Context B, effect of time, F(2, 57) = 3.432, P < 0.05; effect of group, F(1, 49) = 8.377, P < 0.01; group × time, F(2, 57) = 3.284, P < 0.05. Tukey multiple-comparison test: hour 1: P > 0.05; day 1: P > 0.05; day 7: P < 0.01. c Representative immunostaining of spines (green) and DAPI (blue) from GH and SI mice. Arrows indicate thin-shaped spines. Scale bar: 50 μm, 2.5 μm (inset). d Quantification of the densities for total spines, thin spines, mushroom spines, and stubby spines. GH, n = 20 neurons from five mice; SI, n = 18 neurons from four mice; unpaired Student’s t test, spines density, t(36) = 0.5472, P > 0.05; mushroom spines, t(36) = 1.075, P > 0.05; stubby spines, t(36) = 1.128, P > 0.05; thin spines, t = 3.136, P < 0.01. e, f The mEPSC was recorded in CA1 neurons from GH and SI mice (left). Right panel shows the average mEPSC amplitude and frequency. Calibration: 15 pA, 1 s. GH, n = 16 neurons from four mice; SI, n = 15 neurons from four mice; unpaired Student’s t test, mEPSC amplitude, t(29) = 2.293, P < 0.05; mEPSC frequency, t(29) = 1.165, P > 0.05. g Schematic diagram in the top panel shows fEPSP recordings of the CA3-CA1 pathway. The stimulating electrode was placed in the Schaffer of CA3, and a recording pipette was placed in the stratum radiatum of area CA1. Stim stimulating electrode, Rec recording pipette. Representative fEPSP trace at baseline and last 10 min in LTP recordings. Calibration: 0.5 mV, 10 ms. h Quantification of the average fEPSP slope during the last 10 min of the LTP recording from GH and SI mice. GH, n = 9 slices from three mice; SI, n = 8 slices from three mice; two-way ANOVA; effect of group, F(1, 165) = 51.72, P < 0.0001; effect of time, F(10, 165) = 0.02342, P > 0.05; group × time, F(10, 165) = 0.01884, P > 0.05. All data are presented as mean ± SEM. *P < 0.05; **P < 0.01; ***P < 0.001; ****P < 0.0001.
