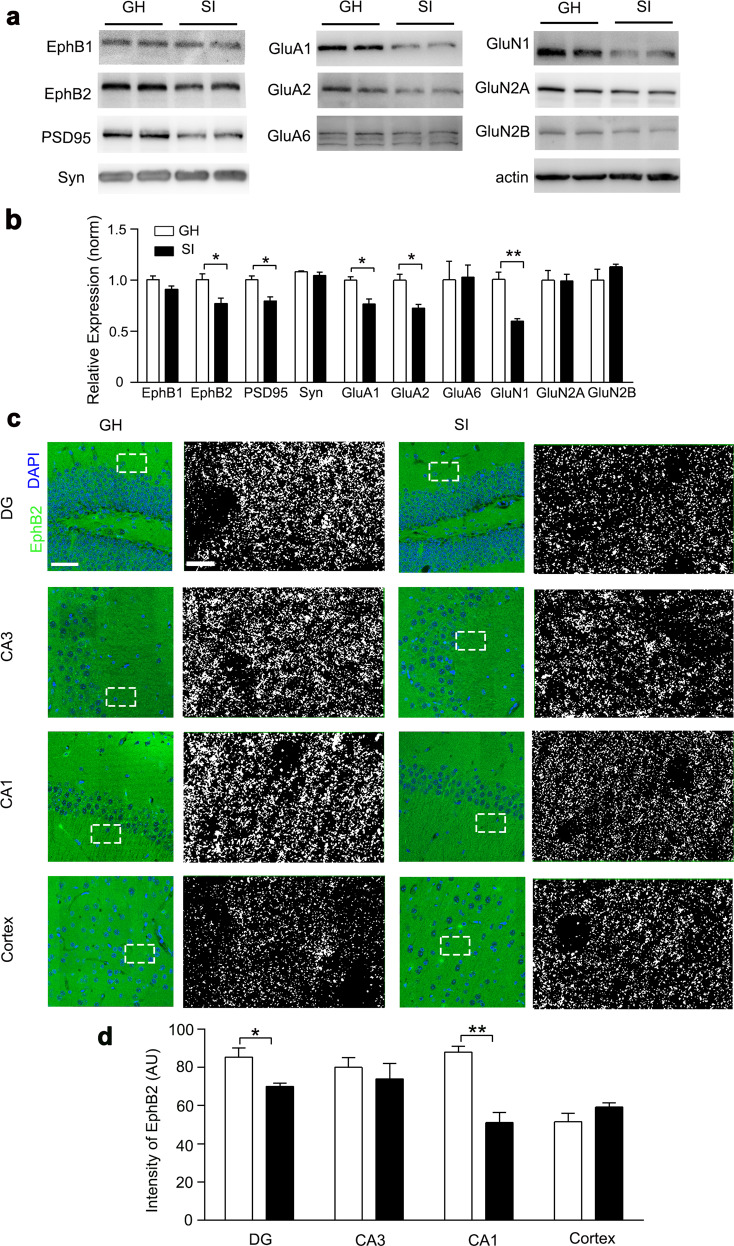
Fig. 2. Hippocampal EphB2 was downregulated in isolated mice.
a The expression levels of EphB1, EphB2, PSD95, syn (synaptophysin), GluA1, GluA2, GluA6, GluN1, GluN2A, and GluN2B proteins in the hippocampus of GH and SI mice. b Quantification of EphB1, EphB2, PSD95, synaptophysin, GluA1, GluA2, GluA6, GluN1, GluN2A, and GluN2B proteins in the hippocampus. n = 3 mice for each group, paired Student’s t test; EphB1, t(2) = 1.960, P > 0.05; EphB2, t(2) = 4.299, P < 0.05; PSD95, t(2) = 2.840, P < 0.05; synaptophysin, t(2) = 0.9553, P > 0.05; GluA1, t(2) = 3.378, P < 0.05; GluA2, t(2) = 4.063, P < 0.05; GluA6, t(2) = 0.1099, P > 0.05; GluN1, t(2) = 3.243, P < 0.05; GluN2A, t(2) = 0.0597, P > 0.05; and GluN2B, t(2) = 1.167, P > 0.05. c Representative immunostaining of EphB2 (green) and DAPI (blue) in the hippocampus and cortex of GH and SI mice. Right panel shows the details (the pictures were processed with the same threshold by Image J). Scale bar: 50 μm (left), 7.5 μm (right). d Quantification of EphB2 fluorescence intensity in the hippocampus and cortex. n = 3 mice for each group, paired Student’s t test, DG, t(2) = 2.972, P < 0.05; CA3, t(2) = 0.6402, P > 0.05; CA1, t(2) = 6.018, P < 0.01; cortex, t(2) = 1.508, P > 0.05. All data are presented as mean ± SEM. *P < 0.05; **P < 0.01.

