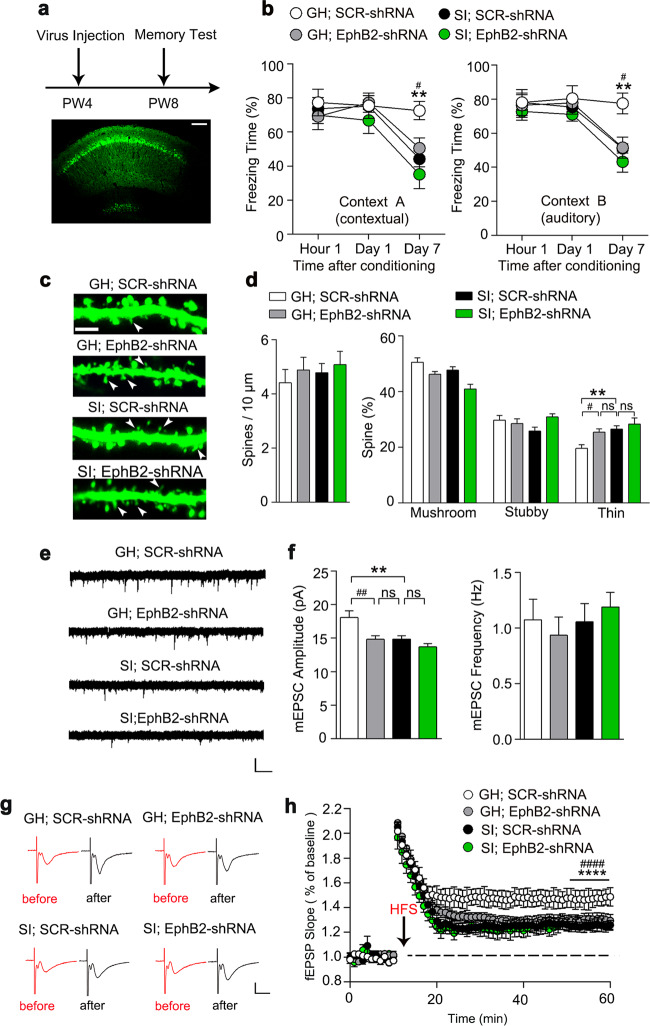
Fig. 3. Knockdown of EphB2 mimics the cognitive deficits in GH mice.
a Top panel shows the experimental paradigm; the bottom panel shows a representative confocal image of virus injection in CA1. Scale bar: 150 μm. b GH mice with EphB2-shRNA showed a decreased freezing time on day 7 after training comparable to the level of control mice in context A (left panel), and similar results were obtained in context B (right panel). GH with control virus, n = 8 mice; GH with EphB2-shRNA, n = 7 mice; SI with control virus, n = 8 mice, SI with EphB2-shRNA, n = 8 mice; two-way ANOVA; for more detailed statistical results, see Supplementary Table 1. c Representative immunostaining of spines (green) in CA1. Arrows indicate thin-shaped spines. Scale bar: 2.5 μm. d The number of thin-shaped spines was increased in GH mice after infusion of EphB2-shRNA. GH with control virus, n = 19 neurons from five mice; GH with EphB2-shRNA, n = 19 neurons from four mice; SI with control virus, n = 20 neurons from five mice; SI with EphB2-shRNA, n = 17 neurons from four mice; two-way ANOVA; for more detailed statistical results, see Supplementary Table 2. e The mEPSC was recorded in CA1 neurons from GH mice with SCR-shRNA, SI mice with SCR-shRNA, GH mice with EphB2-shRNA, and SI mice with EphB2-shRNA. Calibration: 15 pA, 1 s. f Quantification of the average mEPSC amplitude and frequency of these groups. GH with control virus, n = 16 neurons from four mice; GH with EphB2-shRNA, n = 16 neurons from four mice; SI with control virus, n = 16 neurons from four mice; SI with EphB2-shRNA, n = 15 neurons from four mice; two-way ANOVA; for more detailed statistical results, see Supplementary Table 3. g Representative fEPSP trace at baseline and last 10 min in LTP recordings from GH with SCR-shRNA, GH with EphB2-shRNA, SI with SCR-shRNA, and SI with EphB2-shRNA. Calibration: 0.5 mV, 10 ms. h Quantification of the average fEPSP slope during the last 10 min of the LTP recording. GH with SCR-shRNA, n = 9 slices from three mice; GH with EphB2-shRNA, n = 8 slices from three mice; SI with SCR-shRNA, n = 8 slices from three mice; SI with EphB2-shRNA, n = 8 slices from three mice; two-way ANOVA; for more detailed statistical results, see Supplementary Table 4. All data are presented as mean ± SEM. * means the difference between GH mice with SCR-shRNA and SI mice with SCR-shRNA, # means the difference between GH mice with SCR-shRNA and GH mice with EphB2-shRNA. *P < 0.05; **P < 0.01; ****P < 0.0001; #P < 0.05; ##P < 0.01; ####P < 0.0001.

