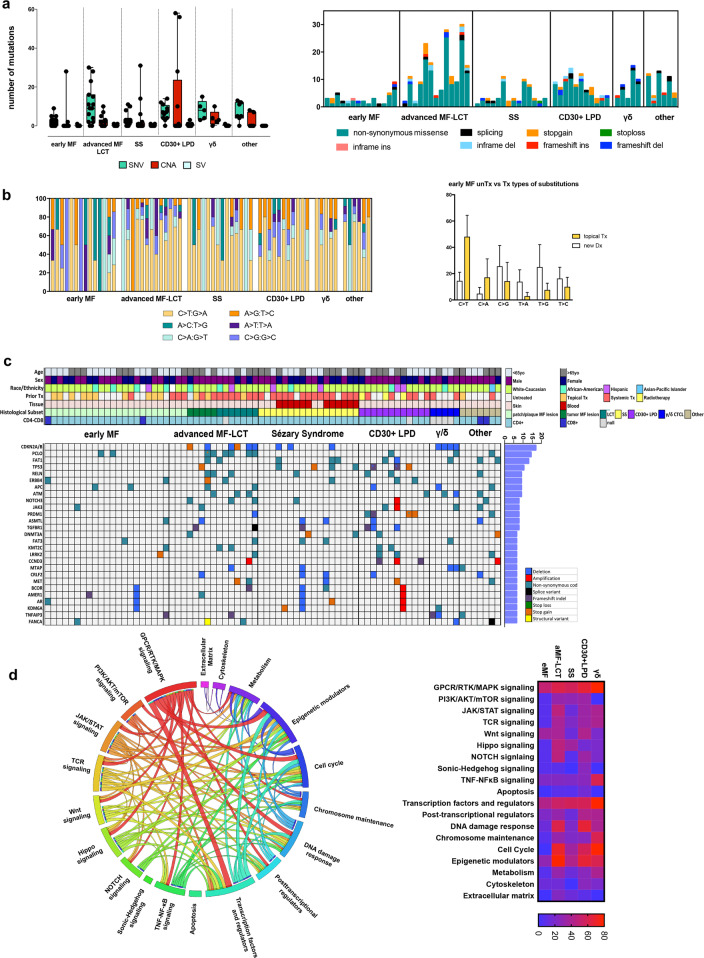
Fig. 1. Genomic alterations and biologic pathways in CTCL.
a Illustration of SNV, CNA, and SV load (left) and representation of the identified SNV types (right) in different CTCL subsets. b Base substitutions identified in different CTCL subsets (left) and base substitutions in newly diagnosed/untreated versus topically treated eMF lesions (right). c Oncoprint of recurrent (>5%) alterations incorporating SNVs, CNAs, and SVs. The first seven rows represent corresponding demographic and clinicopathologic data. d CIRCOS plot illustrating 19 recurrently mutated pathways and their cooccurence in CTCLs (left), as well as the frequency of mutated pathways in different CTCL subsets (right).

