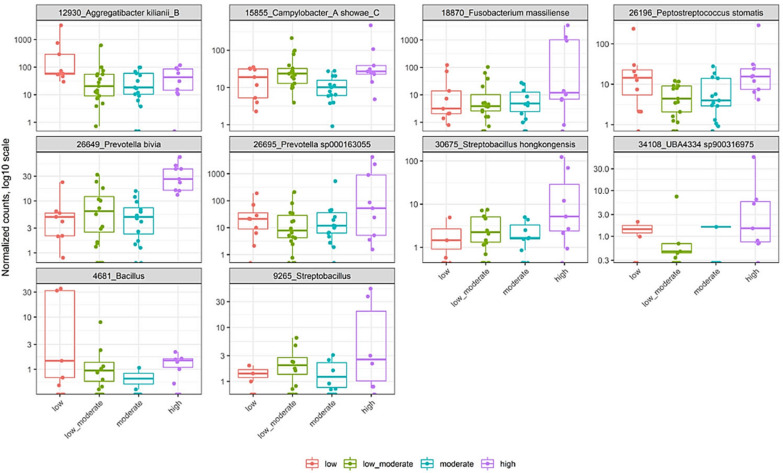
Fig. 2.
Differentially abundant taxa based on FNTD nicotine dependence score. Panel shows relative abundance of normalized counts for the top 10 taxa. Results were calculated by negative binomial models (DESEq2 R package) of the form ∼group for differential abundance testing of taxonomic and subsystem level 3 features. P values were calculated with Likelihood Ratio Tests method. All of the above comparison are significant. Nicotine dependence FTND scores; low, low to moderate, moderate, and high are colored in red, green, blue and pink, respectively

