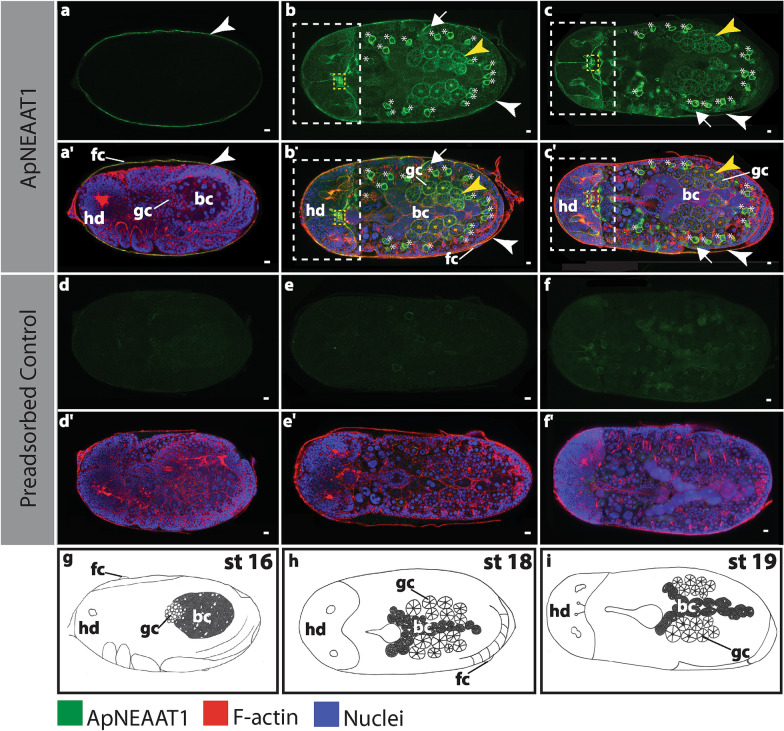
Fig. 5.
ApNEAAT1 localization in embryos during bacteriome maturation (stages 16, 18, and 19). Signals representing ApNEAAT1 immunoactivity are shown in green, F-actin (Phalloidin) is in red, and nuclei (DAPI) are in blue (color key below figure). Confocal images a–c show ApNEAAT1 antibody staining and a’–c’ show merged results for ApNEAAT1 antibody, F-actin, and nuclei. A magnified view of the head region of panels b and b’ is shown in Additional file 5: Figure S5. Confocal images d–f are preadsorbed controls showing the antibody signal and d’–f’ are preadsorbed controls showing the merged results for ApNEAAT1 antibody, F-actin, and nuclei. g–i Illustrations of each embryonic stage. White arrowheads mark ApNEAAT1 antibody localization to the maternal follicular epithelium; yellow arrowheads mark localization to germaria membranes; arrows indicate somatic cell membrane localization; the white dashed rectangle encloses signal appearing in anterior neural structures; the yellow dashed rectangle encloses localization to the corpora cardiaca; asterisks mark localization to prospective hemocytes. Scale bars = 10 µm. bc bacteriocyte, fc follicle cells, gc germ cells, hd head, st stage

