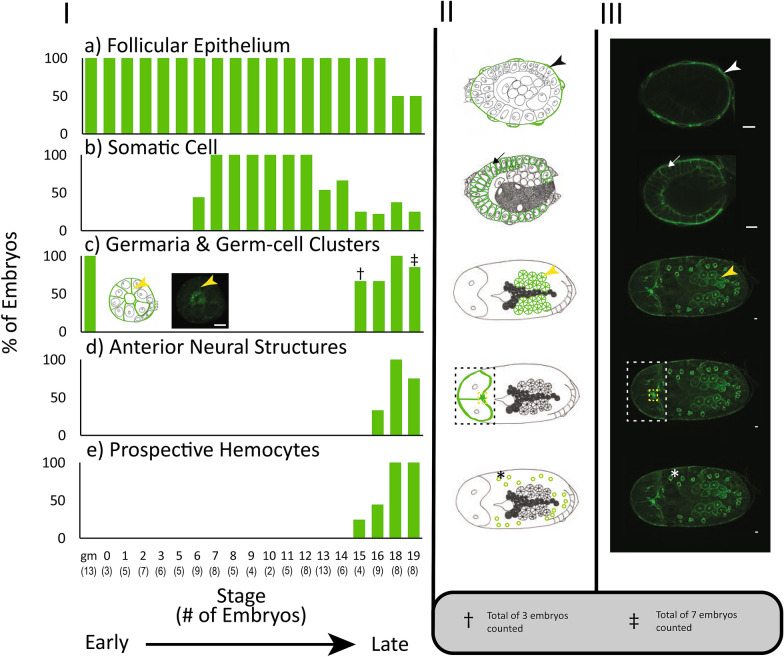
Fig. 6.
ApNEAAT1 localization patterns across embryonic development. The histograms in column I show the percent localization for the five signal patterns (a–e) in embryonic stages from germarium (gm) to stage 19. Stages with fewer than 2 embryos captured were omitted. The number of embryos counted for each stage is listed along the x-axis in parentheses, below the indicated stage. Column II contains illustrations of each signal pattern, where green represents the ApNEAAT1 signal pattern observed. Column III is the confocal image showing the signal pattern (scale bars = 10 μm). White and black arrowheads mark ApNEAAT1 antibody localization to the maternal follicular epithelium; arrows mark somatic cell membrane localization; yellow arrowheads mark localization to germaria membranes; the white and black dashed rectangles enclose signal appearing in anterior neural structures; the yellow dashed rectangles enclose localization to the corpora cardiaca; asterisks mark localization to prospective hemocytes. As a result of embryo orientation or image focal plane, germ-cell clusters/germaria were not visible in all embryos at stages 15 and 19. We report ApNEAAT1 signal only from embryos with visible germ-cell clusters/germaria, and thus, embryo counts were adjusted as indicated by the cross and double-cross symbols (see legend at bottom right of figure)

