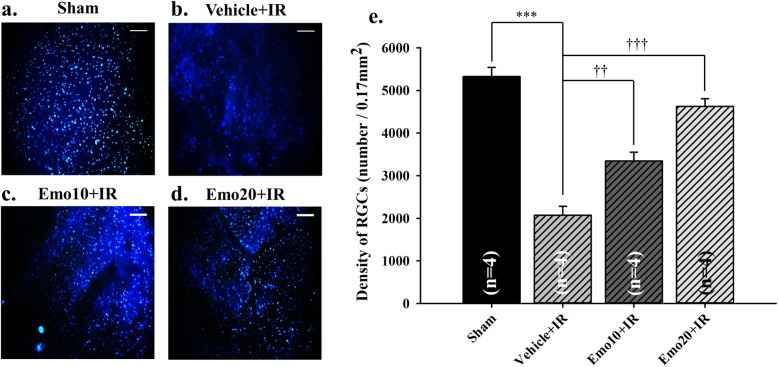
Fig. 4.
Fluorogold retrograde labelling. Micrographs showing the density of retinal ganglion cell (RGC) at various groups. a and e. At the Sham group, the highest density of RGCs was observed 5323.53 ± 215.6/0.17 mm2. b and e. At the Vehicle+IR group, an obvious reduction in the cell density was demonstrated. c ~ d and e. Pre-ischemic intravitreous injection of emodin 10 and 20 μM (Emo10 + IR; Emo20 + IR) in a dose dependent manner and significantly increased the cell density; e. Quantitative analysis of the RGC density. *** or ††/††† denotes a significant (P < 0.001 or P < 0.01/P < 0.001) difference from the Sham or Vehicle+IR group. Emodin dose-dependently and significantly counteracted the ischemia induced reduction in the RGC density. The results are mean ± standard error of the amount of animals demonstrated in the parenthesis. Scale bar is 50 μm. Abbreviation: RGC, retinal ganglion cell. Abbreviations for group names are provided in Table 4

