
Figure 2. Mitochondrial iron accumulation promotes pancreatic tumorigenesis.
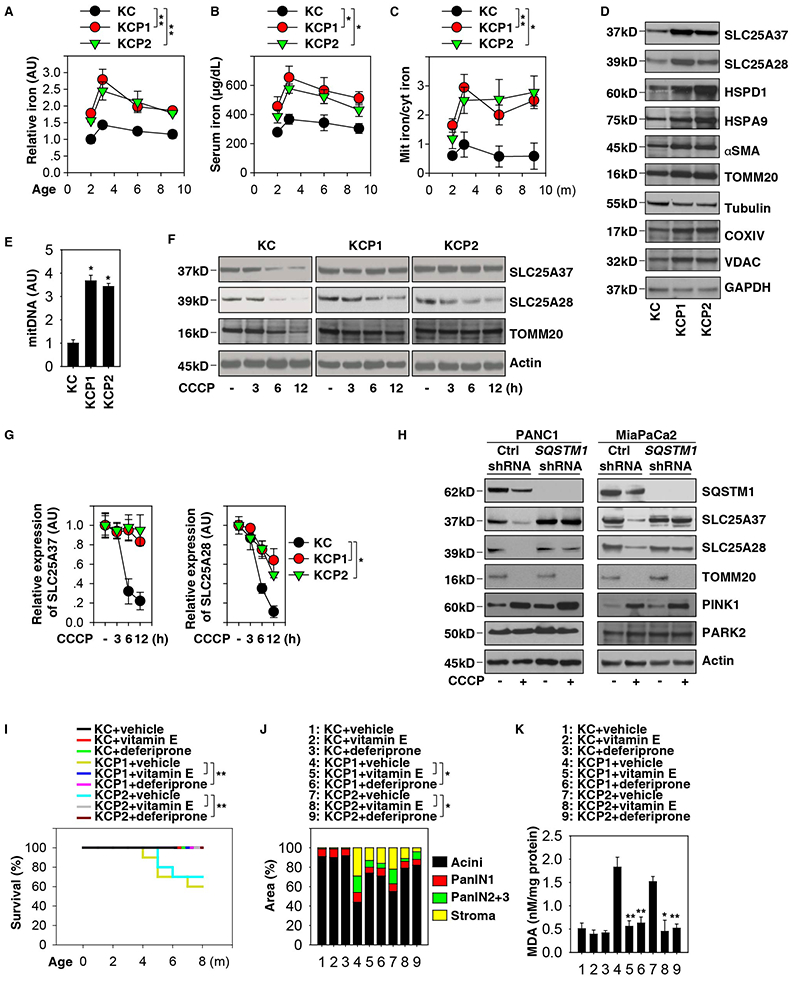
(A) Analysis of iron levels in pancreata from KC, KCP1, and KCP2 mice (n=3 mice/group, ** p < 0.01, ANOVA test, data are expressed as means ± s.e.m., AU, arbitrary units). (B) Analysis of serum iron levels from KC, KCP1, and KCP2 mice (n=3 mice/group, * p < 0.05, ANOVA test, data are expressed as means ± s.e.m.). (C) Analysis of the ratio of mitochondrial iron to cytosolic iron in pancreata from KC, KCP1, and KCP2 mice (n=3 mice/group, * p < 0.05, ** p < 0.01, ANOVA test, data are expressed as means ± s.e.m.). (D) Western blot analysis of indicated protein expression in pancreata from KC, KCP1, and KCP2 mice at three months of age. (E) In parallel, circulating mitochondrial DNA (mitDNA) were assayed (n=5 mice/group, *p < 0.05 versus KC mice, t test, data are expressed as means ± s.e.m., AU, arbitrary units.). (F) Western blot analysis of SLC25A37 and SLC25A28 expression in primary indicated PDAC cells following treatment with CCCP (10 μM) for three to 12 h. (G) Semi-quantification of SLC25A37 and SLC25A28 protein expression in primary indicated PDAC cells following treatment with CCCP (10 μM) for three to 12 h (n=3 mice/group, *p < 0.05, ANOVA test, data are expressed as means ± s.e.m., AU, arbitrary units). (H) The effect of knockdown of SQSTM1 on CCCP (10 μM, 12 h)-induced SLC25A37 and SLC25A28 expression in the indicated human PDAC cell lines. (I) Kaplan-Meier survival analysis was performed for KC or KCP1 or KCP2 mice with or without vitamin E (100 mg/kg p.o., twice per week, started at four weeks of age for eight weeks) or deferiprone (50 mg/kg p.o., twice per week, started at four weeks of age for eight weeks) (n=10-20 mice/group, ** p < 0.01, log-rank test). (J) Histological evaluation of pancreata at three months of age (n=5 mice/group, * p < 0.05, unpaired t-test, data are expressed as percentage of positive area). (K) Pancreatic MDA levels at three months of age (n=3 mice/group, * p < 0.05, ** p < 0.01, unpaired t-test, data are expressed as means ± s.e.m.). See also Figures S1, S2, S3 and S4.