
Figure 3. Mitochondrial iron mediates the Warburg effect in pancreatic tumorigenesis.
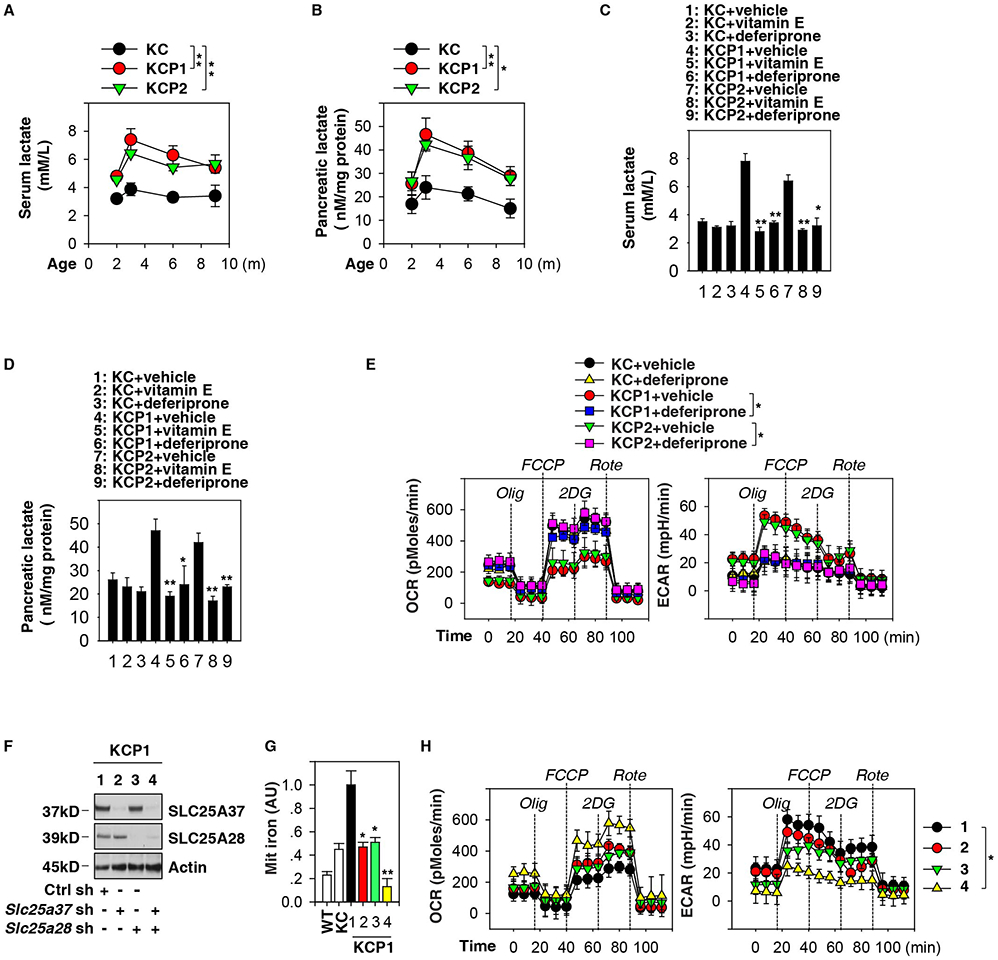
(A) Analysis of serum lactate levels in KC, KCP1, and KCP2 mice (n=3 mice/group, ** p < 0.01, ANOVA test, data are expressed as means ± s.e.m.). (B) Analysis of lactate levels in pancreata in KC, KCP1, and KCP2 mice (n=3 mice/group, * p < 0.05, ** p < 0.01, ANOVA test, data are expressed as means ± s.e.m.). (C) Analysis of serum lactate levels in KC, KCP1 and KCP2 mice with or without vitamin E or deferiprone treatment at three months of age (n=3 mice/group, * p < 0.05, ** p < 0.01 versus vehicle group, unpaired t-test, data are expressed as means ± s.e.m.). (D) Analysis of lactate levels in pancreata in KC, KCP1 and KCP2 mice with or without vitamin E or deferiprone treatment at three months of age (n=3 mice/group, * p < 0.05, ** p < 0.01 versus vehicle group, unpaired t-test, data are expressed as means ± s.e.m.). (E) Indicated PDAC cells were pretreated with deferiprone (100 μM) for 1 h and then treated with oligomycin (“Olig”, 1 μM), carbonyl cyanide-4-(trifluoromethoxy)phenylhydrazone (“FCCP”, 0.3 μM), 2-deoxy-D-glucose (“2DG”, 100 mM), and rotenone (“Rote”, 1 μM) for indicated times. ECAR and OCR were assayed using the Seahorse Bioscience Extracellular Flux Analyzer (n=3, * p < 0.05, ANOVA test, data are expressed as means ± s.e.m.). (F) Western blot analysis of SLC25A37 and SLC25A28 expression in indicated PDAC cells after knockdown of SLC25A37 and SLC25A28. (G) Knockdown of SLC25A37 and SLC25A28 reduced mitochondrial iron levels in PDAC cells from KCP1 mice at three months of age (n=3, * p < 0.05, ** p < 0.01 versus control shRNA group, unpaired t-test, data are expressed as means ± s.e.m., AU, arbitrary units.). (H) Analysis of ECAR and OCR in PDAC cells from KCP1 mice with or without knockdown of SLC25A37 and SLC25A28 (n=3, * p < 0.05, ANOVA test, data are expressed as means ± s.e.m.).