
Figure 4. HIF1A is required for the Warburg effect in pancreatic tumorigenesis.
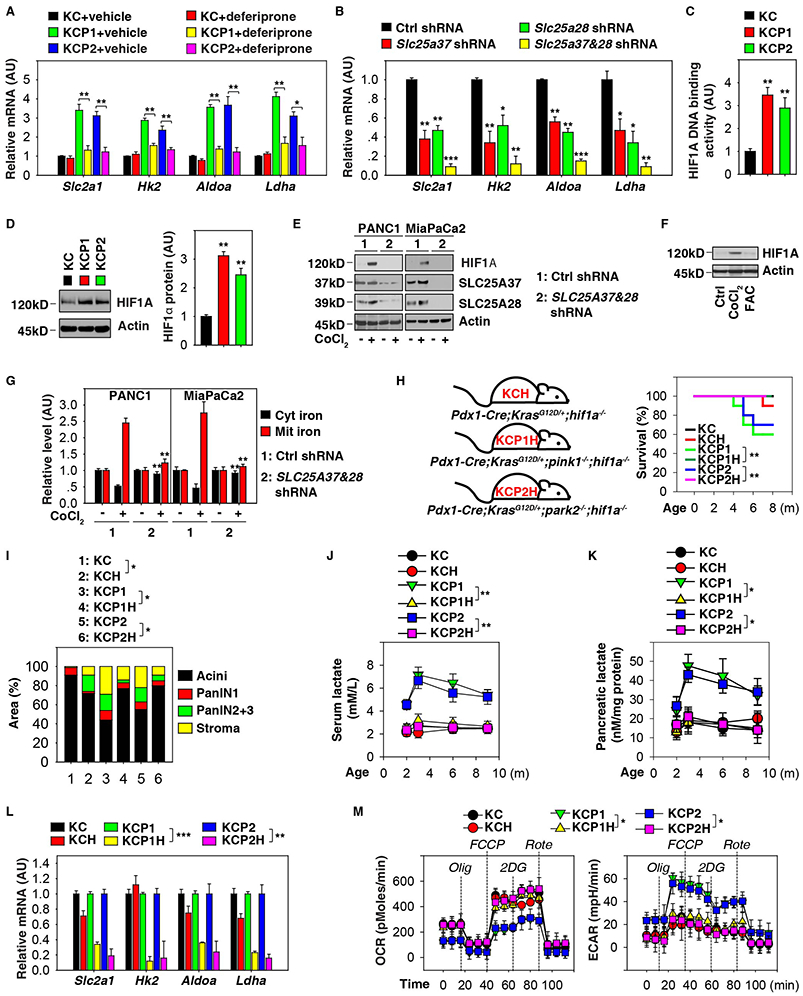
(A) Analysis of the expression of indicated genes in pancreata from KC, KCP1, and KCP2 mice with or without deferiprone treatment at three months of age (n=3 mice/group, * p < 0.05, ** p < 0.01, unpaired t-test, data are expressed as means ± s.e.m., AU, arbitrary units.). (B) Analysis of expression of indicated genes in PDAC cells from KCP1 mice with or without knockdown of SLC25A37 and SLC25A28 (n=3/group, * p < 0.05, ** p < 0.01, *** p < 0.001 versus control shRNA group, unpaired t-test, data are expressed as means ± s.e.m., AU, arbitrary units.). (C) Analysis of HIF1A DNA binding activity in pancreata from KC, KCP1, and KCP2 mice at three months of age (n=3 mice/group, ** p< 0.01 versus KC group, unpaired t-test, data are expressed as means ± s.e.m., AU, arbitrary units.). (D) Analysis of HIF1A protein expression in pancreata from KC, KCP1, and KCP2 mice at three months of age (n=3 mice/group, ** p< 0.01 versus KC group, unpaired t-test, data are expressed as means ± s.e.m., AU, arbitrary units). (E) Knockdown of SLC25A37 and SLC25A28 limited CoCl2 (5 μM, 24 h)-induced HIF1A expression in human PDAC cell lines. (F) Western blot analysis of HIF1A expression in PANC1 cells following treatment with CoCl2 (5 μM) or ferric ammonium citrate (“FAC”, 10 μM) for 24 h. (G) Analysis of iron levels in the mitochondria or cytoplasm in the indicated human PDAC cell lines with or without CoCl2 (5 μM, 24 h) treatment (n=3, ** p< 0.01 versus control shRNA group, unpaired t-test, data are expressed as means ± s.e.m., AU, arbitrary units). (H) Kaplan-Meier survival analysis was performed with the indicated mice (n=10-20 mice/group, ** p < 0.01, log-rank test). (I) Histological evaluation of pancreata at three months of age (n=5 mice/group, * p < 0.05, unpaired t-test, data are expressed as percentage of positive area). (J) Analysis of serum lactate levels in indicated mice (n=3 mice/group, ** p < 0.01, ANOVA test, data are expressed as means ± s.e.m.). (K) Analysis of lactate levels in pancreata in indicated mice (n=3 mice/group, * p < 0.05, ANOVA test, data are expressed as means ± s.e.m.). (L) Analysis of the expression of indicated genes in pancreata from indicated mice at three months of age (n=3 mice/group, ** p < 0.01, *** p < 0.001, unpaired t-test, data are expressed as means ± s.e.m., AU, arbitrary units.). (M) Analysis of ECAR and OCR in PDAC cells from indicated mice at three months of age (n=3, * p < 0.05, ANOVA test, data are expressed as means ± s.e.m.). See also Figure S4.