
. 2020 Jul 17;20(3):255–268. doi: 10.4103/jips.jips_368_19
Copyright: © 2020 The Journal of Indian Prosthodontic Society
This is an open access journal, and articles are distributed under the terms of the Creative Commons Attribution-NonCommercial-ShareAlike 4.0 License, which allows others to remix, tweak, and build upon the work non-commercially, as long as appropriate credit is given and the new creations are licensed under the identical terms.
Figure 3.
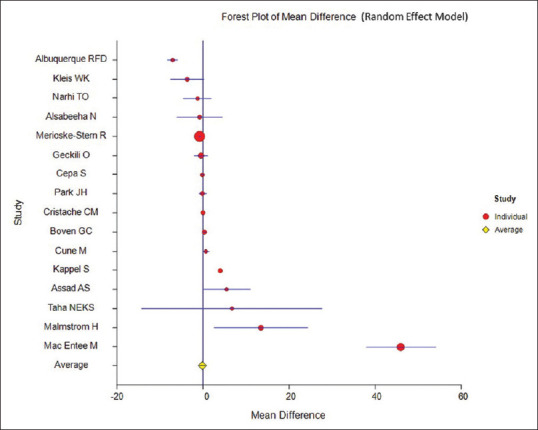
Forest plot of mean differences (random-effects model)