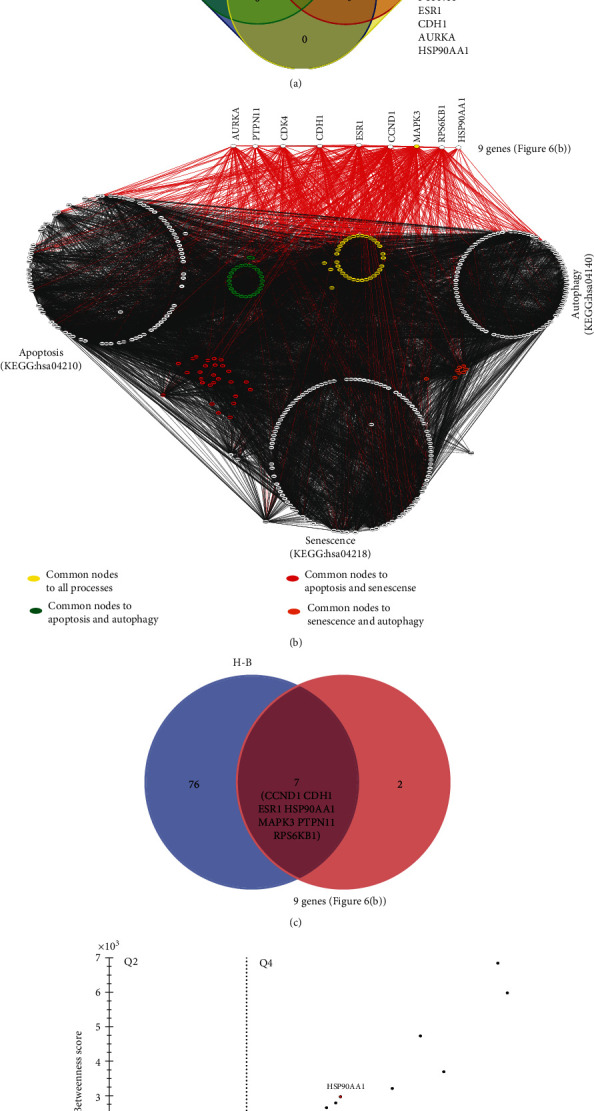
Figure 7.

Seven H-B genes interplay between apoptosis, senescence, and autophagy. (a) Venn diagram between the nine predicted genes and KEGG pathways of apoptosis, senescence, and autophagy. (b) Apoptosis, senescence, and autophagy network. Network connectivity of these nine genes is highlighted in red; common nodes between molecular processes are also highlighted. (c) Venn diagram between nine predicted genes and H-B of apoptosis, senescence, and autophagy network. (d) Centrality analysis of apoptosis, senescence, and autophagy network; only H-Bs were considered. Dashed lines represent thresholds based on medians (degree and betweenness) used to define the quarters. Fourth-quarter (Q4) corresponds to H-Bs with higher degree and betweenness values from the network.
