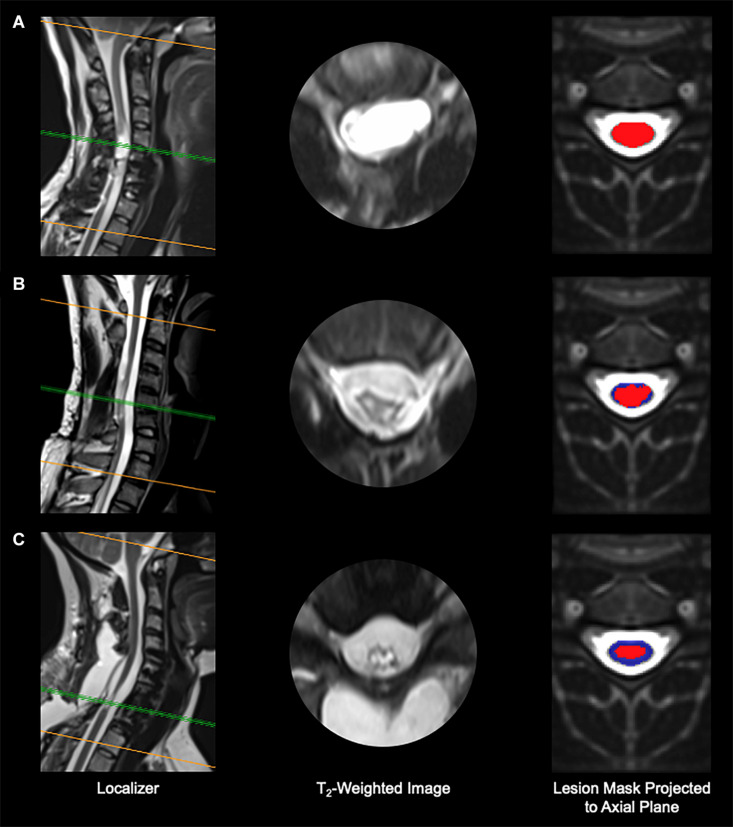
FIGURE 2.
Imaging results from three representative research participants. (A) Participant A99, with no spared tissue of the spinal cord remaining. (B) Participant B21, who shows minimal spared spinal cord tissue. (C) Participant A110, who presents considerable spared spinal cord tissue. Red, spinal cord damage; blue, spared spinal cord tissue.

