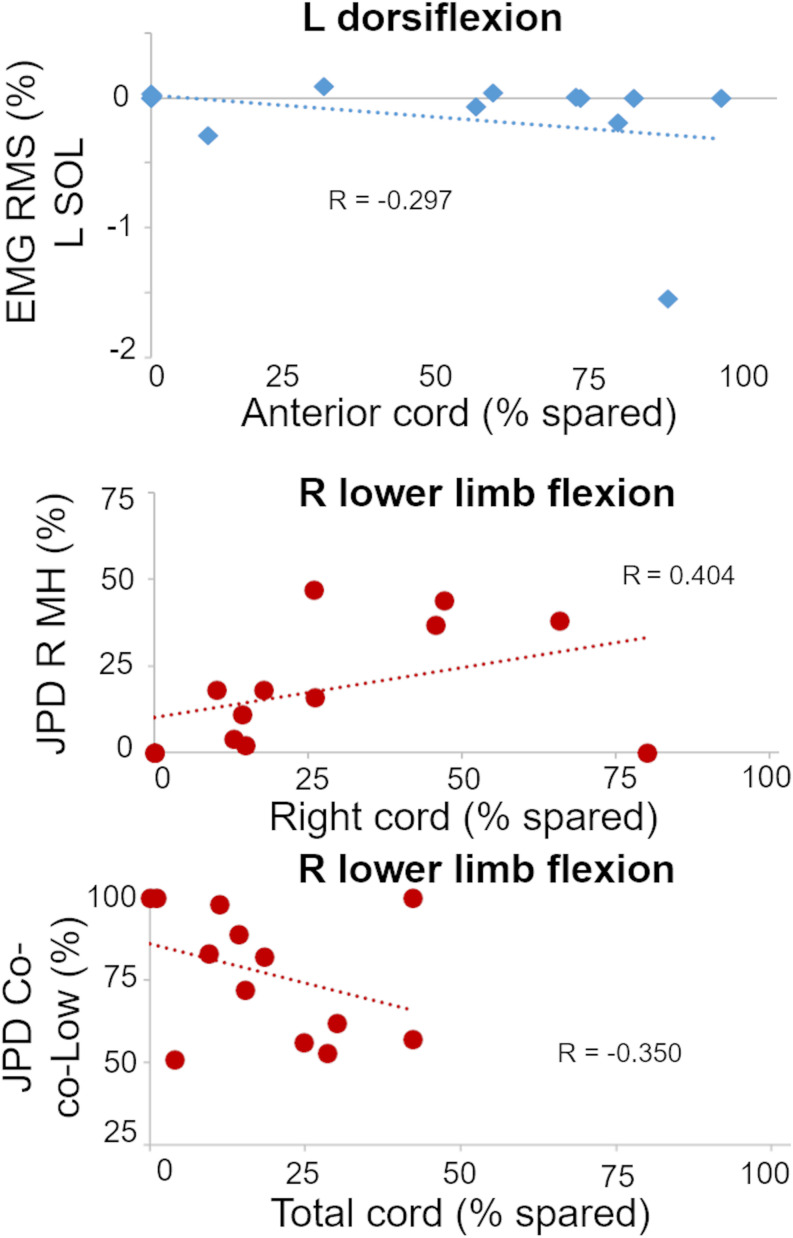
FIGURE 5.
Plots of statistically significant and important correlations between amount of spared tissue of specific cord regions and muscle activation outcomes. R, right side; L, left side; RMS, root mean square; SOL, soleus; JPD R MH, amount of isolated activation of R medial hamstrings; JPD Co-co-Low, amount of co-contraction at lower level of activation between right MH and iliopsoas.

