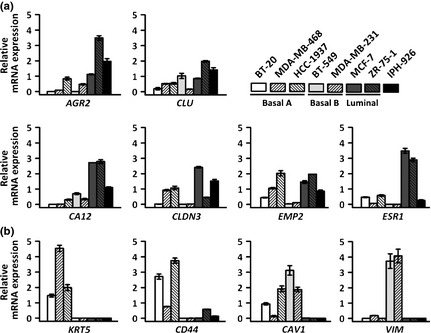
Figure 2.

(a) Validation of the IPH‐926 microarray profile using quantitative real–time RT–PCR for luminal marker genes. (b) Quantitative real–time RT–PCR for basal‐A/basal‐B marker genes. Data are presented as relative mRNA expression with the mean of each gene's expression across the eight cell lines analyzed adjusted to a value of 1 for better visualization. Error bars indicate SEM calculated from three independent experiments.
