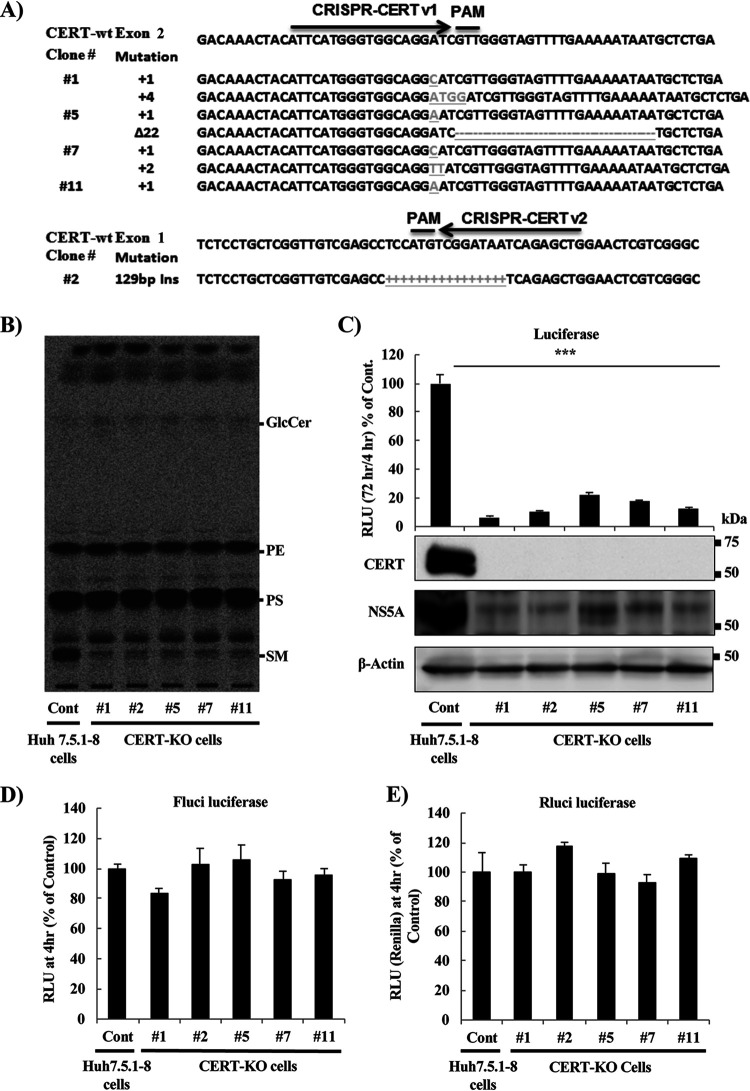
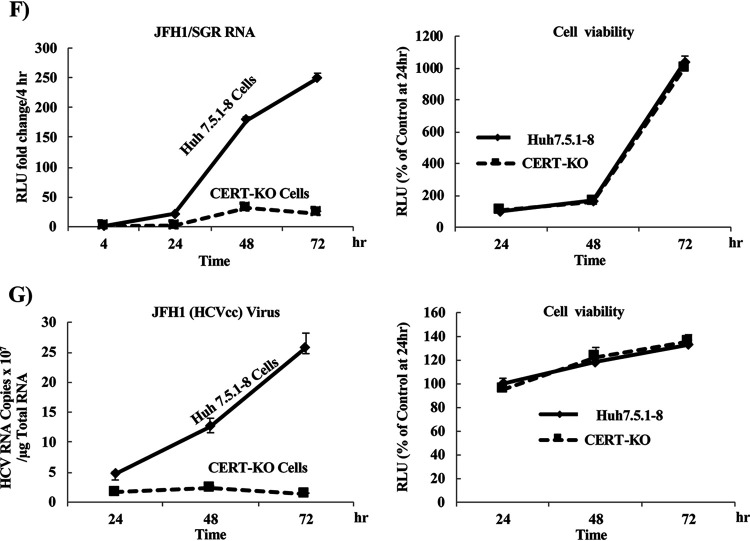
FIG 2.
HCV replicates at significantly lower levels in CERT-KO cells. (A) Using a CRISPR/Cas9 system, two different sequences were used to generate CERT-KO cells from Huh7.5.1-8 parent cells. CRISPR-CERT v1 and its PAM sequence targeted exon 2 (upper), while CRISPR-CERT v2 and its PAM sequence targeted exon 1 (lower). The sequence alignments show exon 2 of the gene encoding the wild-type protein (CERT-wt) aligned with the gene sequences recovered from CERT-KO clones 1, 5, 7, and 11 (upper) and exon 1 of the gene encoding CERT-wt aligned with the gene sequences recovered from CERT-KO clone 2 (lower panel). The observed nucleotide insertions (gray letters or + signs) or deletions (frame shifts; gray − signs) in either both CERT alleles (clones 1, 5, and 7) or one CERT allele (clones 11 and 2) are indicated. (B) The levels of SM were analyzed by TLC after 14C-serine metabolic labeling in each of the CERT-KO clones and in the parental Huh7.5.1-8 cells (Cont). The bands corresponding to SM and other labeled lipid species, including glucosylceramide (GlcCer), phosphatidylethanolamine (PE), and phosphatidylserine (PS), are indicated. (C to E) The parental Huh7.5.1-8 cells (Cont) and the five CERT-KO clones each were electroporated with the combination of 10 μg of in vitro-transcribed JFH1/SGR RNA and 1 μg of in vitro-transcribed Renilla luciferase-encoding RNA (as an internal control); HCV replication was then analyzed by measuring luciferase activities at 4 and 72 h posttransfection. Fold changes in HCV replication were calculated by dividing RLU values at 72 h by those at 4 h; the results were normalized to those of the control (Cont; upper). In parallel, HCV replication was analyzed in transfected Huh7.5.1-8 and CERT-KO cells by measuring HCV protein expression by analysis with WB with anti-NS5A antibodies. CERT protein expression levels also were analyzed using anti-CERT antibodies (lower). Blotting with anti-β-actin antibodies was performed to normalize protein loading. At 4 h postelectroporation, (D) firefly luciferase activities and (E) Renilla luciferase activities in the cell lysates were measured to assess transfection and translation efficacies. (F) Both Huh7.5.1-8 and CERT-KO clone 7 were electroporated with 10 μg JFH1/SGR RNA, and luciferase activities were measured at 4, 24, 48, and 72 h posttransfection; fold changes (left) were calculated as in panel C. Cell viability was evaluated using a Cell TiterGlo luminescent cell viability assay (right). (G) Both Huh7.5.1-8 and CERT-KO clone 7 were infected with HCVcc at a multiplicity of infection (MOI) of 0.1; intracellular HCV RNA levels then were analyzed by real-time RT-PCR at 24, 48, and 72 h postinfection. RNA copy numbers were normalized to 1 μg total RNA (left). Cell viability was evaluated using a Cell TiterGlo luminescent cell viability assay (right). Values were obtained from quadruplicate wells in at least three independent experiments and are presented as means ± SDs. ***, P < 0.005 (two-sided Student’s t test).


