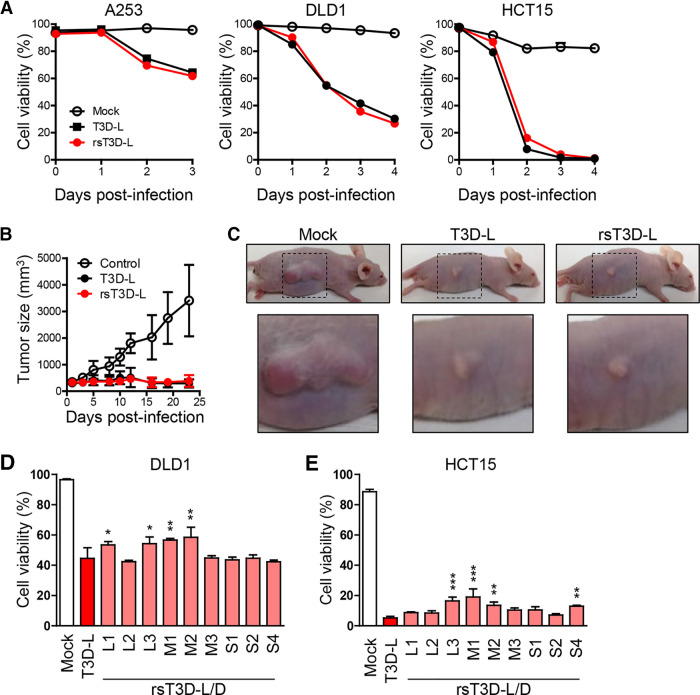
FIG 2.
Reverse genetics approach for T3D-L. (A) Oncolytic activity of T3D-L and rsT3D-L in A253, DLD1 and HCT15 cells. Cells were infected with viruses at an MOI of 10 PFU/cell for A253 and 30 PFU/cell for DLD1 and HCT15, then collected and stained with propidium iodide (PI), and subjected to flow cytometry analysis. Cell viability was determined by calculating the ratio of PI-negative cells to total cells. Each value represents an average from triplicate samples. The error bars indicate the standard deviation. Representative results from three independent experiments are shown. (B) Oncolytic activity of T3D-L and rsT3D-L in a mouse xenograft model. A253 cells were transplanted into 4-week-old BALB/cAJcl-nu nude mice. After tumors developed, mice received an intratumoral injection of T3D-L (n = 6), rsT3D-L (n = 6), or the same volume of DMEM (n = 6), every 2 to 3 days. Tumor growth was monitored for 23 days. Each value represents the average volume (six tumors). (C) Representative images showing tumor size at 14 days. (D and E) Oncolytic activity of T3D-L/T3D-D monoreassortant viruses in cancer cell lines. DLD1 (D) and HCT15 (E) cells were infected with T3D-L/T3D-D monoreassortant viruses at an MOI of 10 PFU/cell. The cells were collected 3 days after infection. Cell viability was determined by PI staining. Each value represents an average from triplicate samples. The error bars indicate the standard deviation. Representative results from two independent experiments are shown. The significance of differences was determined by one-way ANOVA; *, P < 0.05; **, P < 0.01; ***, P < 0.001.

