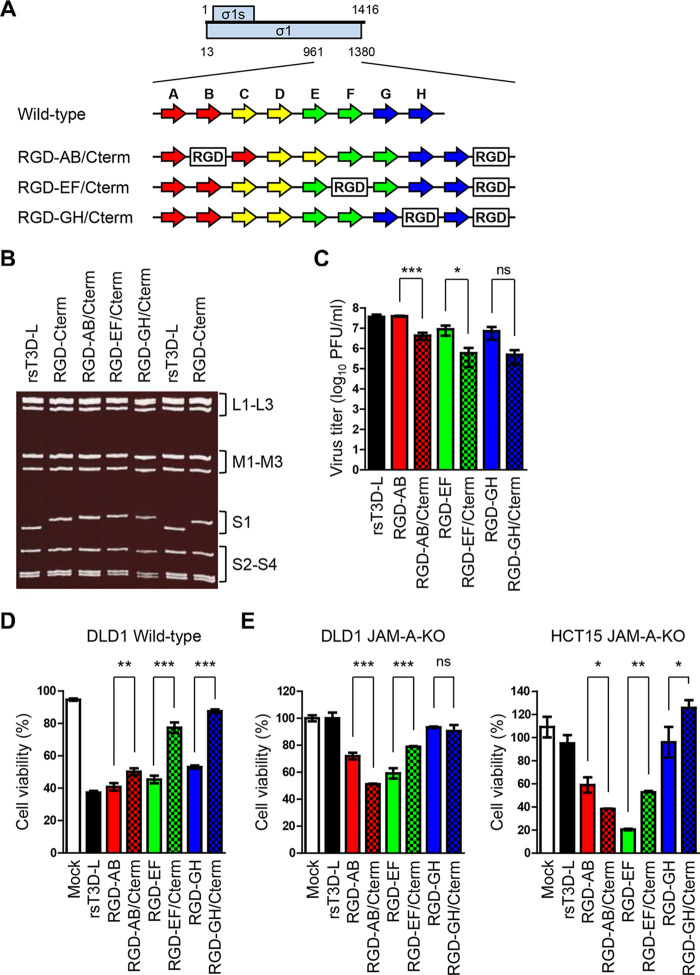
FIG 6.
Generation and in vitro characterization of viruses harboring multiple RGD sequences. (A) Schematic presentation of the C-terminal head domain of σ1 and the plasmids used to recover RGD σ1-modified viruses. The ORFs of the σ1 and σ1s proteins are denoted by blue boxes (top). Each number indicates a nucleotide position. The eight β-sheet structures (A to H) are indicated by arrows (colors are the same as in Fig. 3A). The RGD peptide sequence is denoted by white boxes. (B) Electrophoretic analysis of viruses harboring multiple RGD sequences. Viral dsRNA was extracted from virions, separated by SDS-PAGE, and stained with ethidium bromide. The electrophoretic patterns of rsT3D-L and RGD-Cterm are shown for reference. Gene segments are indicated. (C) Replication of viruses harboring multiple RGD sequences in L929 cells. Cells were infected with viruses at an MOI of 0.01 PFU/cell. Samples were collected 72 h postinfection. The virus titer in the cell lysate was determined in a plaque assay. Each value represents an average from triplicate samples. The error bars indicate the standard deviation. Significant differences were determined using Student’s t test; *, P < 0.05; ***, P < 0.0001; ns, not significant. (D and E) In vitro oncolytic activity of the viruses. Wild-type DLD1 (D) and DLD1 JAM-A-KO and HCT15 JAM-A-KO cells (E) were infected with each virus at an MOI of 10 PFU/cell or mock-infected with DMEM. Cell viability was determined in a WST1 colorimetric assay. Cell viability is shown as a score relative to that of mock samples. Each value represents an average from triplicate samples. The error bars indicate the standard deviation. Representative results from two independent experiments are shown. Significant differences were determined using Student’s t test; *, P < 0.05; **, P < 0.001; ***, P < 0.0001; ns, not significant.

